In previous posts of our MongoDB DBA series, we have covered Deployment, Configuration, Monitoring (part 1), Monitoring (part 2) and backup. Now it is time to recover MongoDB using a backup we made in the previous blog post.
As we learned in the previous blog post, there are two types of backups: logical and physical backups. The physical backups for MongoDB are basically file system backups, and they will be relatively easy to restore. We will leave them out of the scope today. Also the new Percona MongoDB Consistent Backup tool will allow you to make consistent snapshots of your MongoDB sharded clusters. This versatile tool is relatively new (beta) and still quite complex to use and restore, but it is supported in ClusterControl 1.3.2. We will cover this tool in a future blog post.
In this blog post we will cover the use cases for restoring your logical backups with MongoDB. These use cases will vary from restoring a single node, restoring a node in an existing replicaSet and seeding a new node in a replicaSet.
MongoDB backup format
We have to explain the MongoDB backup format first. When performing a mongodump, all collections within the designated databases will be dumped as BSON output. If no database is specified, MongoDB will dump all databases except for the admin, test and local databases as they are reserved for internal use.
When you are running the MMAP storage engine, the dumps should be equal to the data you have on disk, as both MMAP and the dumps are stored as BSON files. If you run WiredTiger, naturally those files would differ, as the storage engine stores them in a totally different format. Given that you export the data via a dump, the content of the data is the same.
Archive file
By default mongodump will create a directory called dump, with a directory for each database containing a BSON file per collection in that database. Alternatively you can tell mongodump to store the backup within one single archive file. The archive parameter will concatenate the output from all databases and collections into one single stream of binary data. Additionally the gzip parameter can naturally compress this archive, using gzip. In ClusterControl we stream all our backups, so we enable both the archive and gzip parameters.
Include the oplog
Similar to mysqldump with MySQL, if you create a backup in MongoDB, it will freeze the collections while dumping the contents to the backup file. As MongoDB does not support transactions you can’t make a 100% fully consistent backup, unless you create the backup with the oplog parameter. Enabling this on the backup includes the transactions from the oplog that were executing while making the backup. This behaviour is similar to Percona Xtrabackup that uses the MySQL binary log to capture all transactions during the backup process.
Restoring MongoDB from a backup
There are basically two ways you can use a BSON format dump:
- Run mongod directly from the backup directory
- Run mongorestore and restore the backup
Run mongod directly from a backup
A prerequisite for running mongod directly from the backup is that the backup target is a standard dump, and is not gzipped.
This command will start the MongoDB daemon with the data directory set to the backup location:
[root@node ~] mongod --datapath /backups/backup_10.10.34.12_2016-08-02_180808/The MongoDB daemon will then check the integrity of the data directory, add the admin database, journals, collection and index catalogues and some other files necessary to run MongoDB. Obviously if you ran WiredTiger as the storage engine before, it will now run the existing collections as MMAP. But for simple data dumps or integrity checks this works fine.
Run mongorestore
A better way to restore would obviously be by restoring the node using mongorestore:
[root@node ~] mongorestore /backups/backup_10.10.34.12_2016-08-02_180808/In case of a backup made by ClusterControl (or one that is in archive and gzipped format) the command is slightly different:
[root@node ~] mongorestore --gzip --archive=/backups/backup_10.10.34.12_2016-08-02_180808.gzThis will restore the backup into the default server settings (localhost, port 27017) and overwrite any databases in the backup that reside on this server. Now there are tons of parameters to manipulate the restore process, and we will cover some of the important ones.
Object validation
As the backup contains BSON data, you would expect the contents of the backup to be correct. However it could have been the case that the document that got dumped was malformed to begin with. Mongodump does not check the integrity of the data it dumps. So the objcheck parameter will enable object checking before it gets sent to the server. This flag is enabled by default since MongoDB version 2.4. If you are running an older version, better to enable this flag.
Oplog replay
As we described earlier, adding the oplog to your backup will enable you to perform a consistent backup and do a point-in-time-recovery. Enable the oplogReplay parameter to apply the oplog during restore process. To control how far to replay the oplog, you can define a timestamp in the oplogLimit parameter. Only transactions up until the timestamp will then be applied.
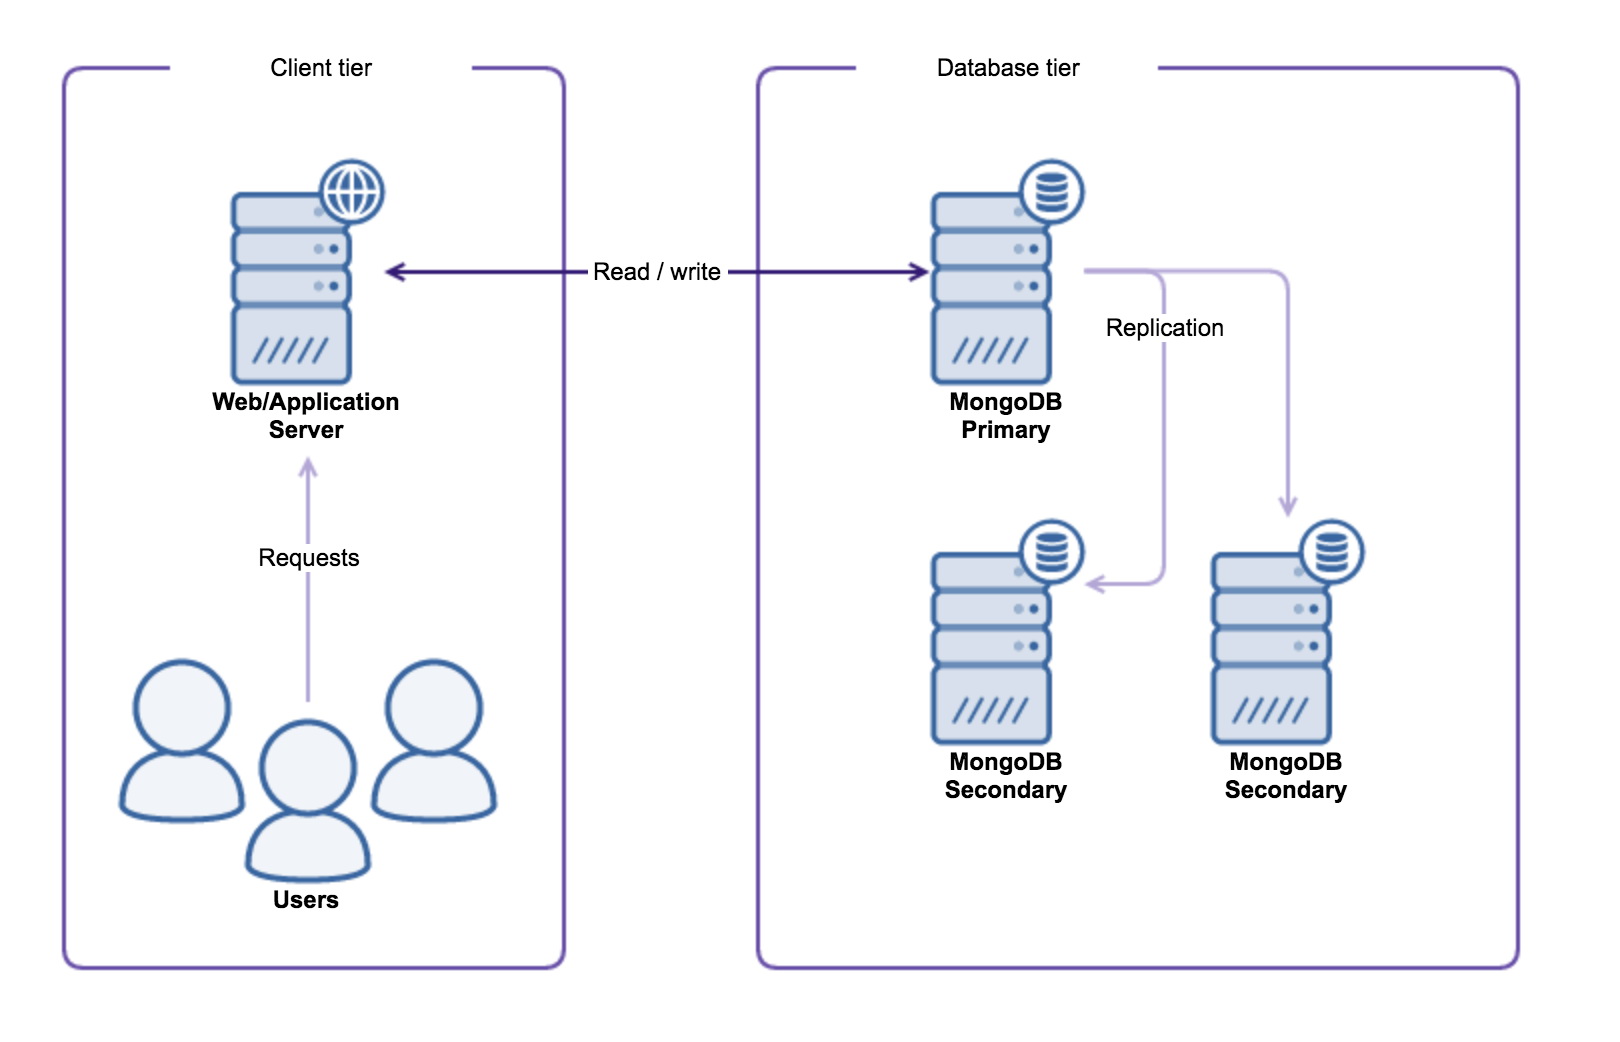
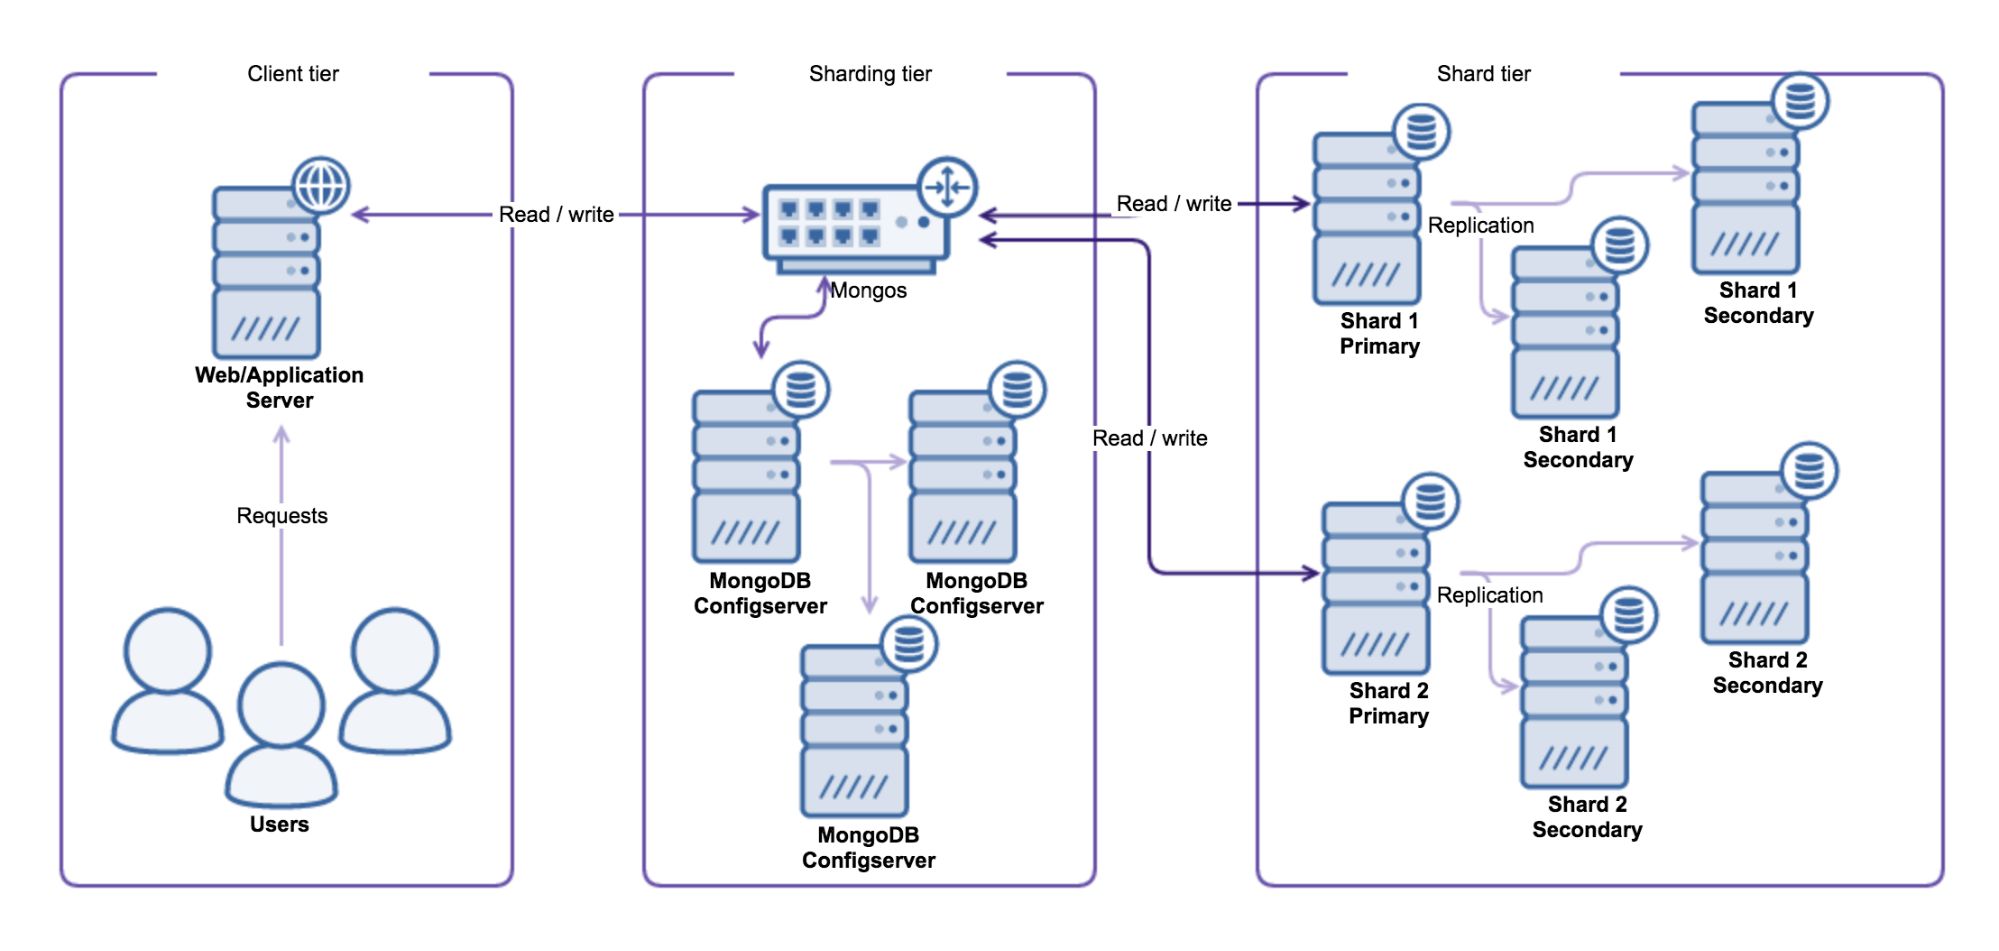
Restoring a full replicaSet from a backup
Restoring a replicaSet is not much different than restoring a single node. Either you have to set up the replicaSet first, and restore directly into the replicaSet. Or you restore a single node first, and then use this restored node to build a replicaSet.
Restore node first, then create replicaSet
We will start mongod on the first node running in the foreground:
[root@firstnode ~] mongod --dbpath /var/lib/mongodb/Restore the node in a second terminal
[root@firstnode ~] mongorestore --gzip --archive=/backups/backup_10.10.34.12_2016-08-02_180808.gzNow stop mongod in the first terminal, and start it again with the replicaSet enabled:
[root@firstnode ~] mongod --dbpath /var/lib/mongodb/ --replSet <set_we_restore>Then initiate the replicaSet in the second terminal:
[root@firstnode ~] mongo --eval “rs.initiate()”After this you can add the other nodes to the replicaSet:
[root@firstnode ~] mongo
test:PRIMARY> rs.add(“secondnode:27017”)
{ "ok" : 1 }
test:PRIMARY> rs.add(“thirdnode:27017”)
{ "ok" : 1 }
Now the second and third node will sync their data from the first node. After the sync has finished our replicaSet has been restored.
Create a ReplicaSet first, then restore
Different to the previous process, you can create the replicaSet first. First configure all three hosts with the replicaSet enabled, start up all three deamons and initiate the replicaSet on the first node:
[root@firstnode ~] mongo
test:PRIMARY> rs.initiate()
{
    "info2" : "no configuration specified. Using a default configuration for the set",
    "me" : "firstnode:27013",
    "ok" : 1
}
test:PRIMARY> rs.add(“secondnode:27017”)
{ "ok" : 1 }
test:PRIMARY> rs.add(“thirdnode:27017”)
{ "ok" : 1 }
Now that we have created the replicaSet, we can directly restore our backup into it:
mongorestore --host <replicaset>/<host1>:27017,<host2>:27017,<host3>:27017 --gzip --archive=/backups/backup_10.10.34.12_2016-08-02_180808.gzIn our opinion restoring a replicaSet this way is much more elegant. It is closer to the way you would normally set up a new replicaSet from scratch, and then fill it with (production) data.
Seeding a new node in a replicaSet
When scaling out a cluster by adding a new node in MongoDB, an initial sync of the dataset must happen. With MySQL replication and Galera, we are so accustomed to use a backup to seed the initial sync. With MongoDB this is possible, but only by making a binary copy of the data directory. If you don’t have the means to make a file system snapshot, you will have to face downtime on one of the existing nodes. The process, with downtime, is described below.
If you only have one node, you have to shut down the primary mongod:
[root@primary ~] service mongod stopStart up the receiving side of the new node:
[root@newnode ~] cd /var/lib/mongodb
[root@newnode ~] nc -l 7000 | tar -xpf -
Make a copy of the data directory and copy this over to the new node:
[root@primary ~] tar -cf - /var/lib/mongodb | nc newnode 7000Once the copy process has finished, start mongod on both nodes:
[root@primary ~] service mongod start
[root@newnode ~] service mongod start
And now you can add the new node to the replicaSet.
[root@primary ~] mongo
test:PRIMARY> rs.add("newnode:27017")
{ "ok" : 1 }
In the MongoDB log file, the joining process of the new node will look similar to this:
I REPL     [ReplicationExecutor] This node is newnode:27017 in the config
I REPL     [ReplicationExecutor] transition to STARTUP2
I REPL     [ReplicationExecutor] Member primary:27017 is now in state PRIMARY
I REPL     [ReplicationExecutor] syncing from: primary:27017
I REPL     [ReplicationExecutor] transition to RECOVERING
I REPL     [ReplicationExecutor] transition to SECONDARY
That’s it, you have just managed to save yourself from a long syncing process. Obviously this caused downtime for us, which is normally unacceptable for a primary. You can also use a secondary to copy your data from, but downtime on the secondary could lead the primary to lose the majority in the cluster. If you are running MongoDB in a WAN environment, this is a good reason to enable filesystem snapshots in your environment.
Seeding with a backup
So what would happen if you restore the new node from a mongodump backup instead, and then have it join a replicaSet? Restoring from a backup should in theory give the same dataset. As this new node has been restored from a backup, it will lack the replicaSetId and MongoDB will notice. As MongoDB doesn’t see this node as part of the replicaSet, the rs.add() command then will always trigger the MongoDB initial sync. The initial sync will always trigger deletion of any existing data on the MongoDB node.
If you would do such a thing, let the log file speak for itself:
I REPL     [ReplicationExecutor] This node is newnode:27017 in the config
I REPL     [ReplicationExecutor] transition to STARTUP2
I REPL     [ReplicationExecutor] Member primary:27017 is now in state PRIMARY
I REPL     [rsSync] ******
I REPL     [rsSync] creating replication oplog of size: 1514MB...
I STORAGE  [rsSync] Starting WiredTigerRecordStoreThread local.oplog.rs
I STORAGE  [rsSync] The size storer reports that the oplog contains 0 records totaling to 0 bytes
I STORAGE  [rsSync] Scanning the oplog to determine where to place markers for truncation
I REPL     [rsSync] ******
I REPL     [rsSync] initial sync pending
I REPL     [ReplicationExecutor] syncing from: primary:27017
I REPL     [rsSync] initial sync drop all databases
I STORAGE  [rsSync] dropAllDatabasesExceptLocal 2
I REPL     [rsSync] initial sync clone all databases
The replicaSetId is generated when initiating a replicaSet, and unfortunately can’t be set manually. That’s a shame as recovering from a backup (including replaying the oplog) would theoretically give us a 100% identical data set. It would be nice if the initial sync was optional in MongoDB to satisfy this use case.
ReplicaSet node recovery
It’s a different story for nodes that are already part of a replicaSet. If you have a broken node in your replicatSet you can have it fixed by issuing a resync of the node. However if you are replicating over a WAN and your database / collection is in the terrabyte range, it could take a long time to restore. This is when the seeding would come in handy as well.
Conclusion
We have explained in this blog post various ways to restore a MongoDB node or replicaSet, and what the caveats are. MongoDB backups aren’t very difficult to restore, and in worst case you can even run the database directly from the BSON files in the backup.
In the next blog post, we will start scaling out read requests with MongoDB, and discuss the things you should look out for!