Quantcast
Channel: Severalnines - MongoDB
Viewing all 206 articles
Browse latest View live

On-premises Deployment and Monitoring of MongoDB Sharded Clusters

$
0
0

Last year, we did a survey asking our users about any other databases they were using alongside MySQL. A clear majority were interested in using other databases alongside MySQL, these included (in order of popularity) MongoDB, PostgreSQL, Cassandra, Hadoop, Redis. 

Today, we are glad to announce the availability of ClusterControl for MongoDB, which includes a MongoDB Configurator to easily deploy MongoDB Sharded Clusters, as well as on-premise monitoring and cluster management. Setting up a sharded cluster is not a trivial task, and this is probably the area where most users need help with. Sharding allows MongoDB to handle distribution of data across a number of nodes to maximise use of disk space and dynamically load balance queries. Each shard consists of a replica set, which provides automated failover and redundancy to ensure that data exists on at least 3 servers. 

MongoDB Cluster Setup

Using the configurator, you can set up a MongoDB cluster with auto sharding and full failover support using replica sets. The setup looks like this;

  • N number of shards, each shard consisting of 3 shard serves, the mongod instances (started with --shardsvr parameter)
  • Three Config servers - these are mongod instances (started with --configsvr parameter) that store the meta data for the shards. As per documentation, "a production shard cluster will have three config server processes, each existing on a separate machine. Writes to config servers use a two-phase commit to ensure atomic and replication transaction of the shard cluster's metadata".
  • Mongo query routers (mongos) - clients connect a mongos, which route queries to the appropriate shards. They are self contained and will usually be run on each of your application servers. 

We use the following defaults:

  • Config servers have their data directory in /var/lib/mongodb/config and listens on port 27019
  • mongod shard servers have their data directory in /var/lib/mongodb, and listens on port 27018
  • mongos listens on port 27017

We also have a ClusterControl server, our on-premise tool to manage and monitor the MongoDB cluster. ClusterControl collects monitoring data from all the various servers, and stores the data on a local monitoring database (cmondb). The admin can visualise their shards and drill down into nodes using the web interface. 


ClusterControl also manages all the MongoDB nodes, and will restart any nodes that fail. 

Using the MongoDB Configurator

The wizard is very straightforward, and we would recommend you stick with the default values. You will however need to key in the IP addresses of the servers you are deploying on. At the end, the wizard will generate a deployment package with your unique settings. You can use this package and run one command (./deploy.sh) to deploy your entire cluster. 

If you have small servers (with < 10GB of free disk space) for testing, then you can also use "smallfiles", which will make the config servers and shard servers use less disk space.


One small note, we do require that you can ssh from the ClusterControl server to the other servers using key-based authentication, so you don't have to type in ssh passwords. If you have not setup key-based authentication, the deploy.sh script will ask you if you can ssh without typing in passwords. If you can't, it will be setup for you.


Monitoring and Management

The ClusterControl server will sample quite a lot of data from all the MongoDB nodes as well from the underlying OS/HW, and is a tool to find out what is going on in your cluster. The default sampling time is 10 seconds, but this can be changed. The collected data is also used to build up a logical topology of the cluster, and ClusterControl can thereby derive the general health of the cluster. 

Failed processes are automatically restarted, and users are alerted if processes fail too often or too fast. Other alerts are created if replication between PRIMARY and SECONDARY is lagging, or actually completely broken, and users will get an advise on what to do next. 

A command line tool, s9s_mongodb_admin allows you to remove blocking lockfiles, stop the entire cluster in case it is needed, and start it again.

Future Work - more management functionality

We are currently working on the following:

  • cluster backups, storage to a centralized location
  • restaging failed servers with data from a healthy server
  • adding nodes to a shard
  • adding shards
  •  

Blog category:


Install ClusterControl on Top of Existing MongoDB Sharded Cluster

$
0
0

**Attention: The instructions in this blog post are outdated. Please refer to ClusterControl Quick Start Guide for updated instructions.


In this post, we are going to show you on how to install and integrate ClusterControl on top of an existing MongoDB Sharded Cluster with a replica set of 3 nodes


MongoDB Sharded Cluster Setup


In a sharded cluster, we need to have three types of server:

  • config server (configsvr) - holds metadata of the cluster (minimum 3 servers)
  • shard server (shardsvr) - container that holds subset of data, including replica set (minimum 2 servers)
  • routing server (mongos) - route operations from applications and clients to the shardsvr instances (minimum 1 server)


The following sequence explains query routing in a sharded cluster:

  1. Application sends a write query to one of mongos (port 27017)
  2. mongos connects to configsvr (port 27018) to determine the primary shardsvr 
  3. mongos then connects to a primary shardsvr (port 27019) to write the data
  4. Data partitioning (sharding) and replication will be automatically handled by shardsvr instance 


In our setup, we have 3 servers running CentOS 6.3 64bit. On each server, we have colocated a configsvr, shardsvr and mongos. Each server has 3 MongoDB configuration files:

  • /etc/mongodb.config.conf - configsvr configuration
  • /etc/mongodb.shard.conf - shardsvr and replSet configuration
  • /etc/mongos.conf - mongos configuration


Our MongoDB dbpath is located at /var/lib/mongodb, while configdb is located at /var/lib/mongodb/configdb and all MongoDB logs generated under /var/log/mongodb directory.

We started all MongoDB instances using following commands in each server:


$ mongod -f/etc/mongodb.config.conf
$ mongod -f/etc/mongodb.shard.conf
$ mongos -f/etc/mongos.conf


Install ClusterControl Server

We will need a separate server to run ClusterControl, as illustrated below:

1. SSH into ClusterControl server and make sure that you have IPtables and SElinux turned off:


$ service iptables stop
$ setenforce 0
$ sed -i.bak 's#SELINUX=enforcing#SELINUX=disabled#g'/etc/selinux/config


2. It is highly recommended to enable passwordless SSH with key authentication between ClusterControl and agents. Generate a RSA key and copy it to all nodes:


$ ssh-keygen-t rsa # just press enter for all prompts
$ ssh-copy-id -i ~/.ssh/id_rsa root@192.168.197.40
$ ssh-copy-id -i ~/.ssh/id_rsa root@192.168.197.41
$ ssh-copy-id -i ~/.ssh/id_rsa root@192.168.197.42
$ ssh-copy-id -i ~/.ssh/id_rsa root@192.168.197.43


3. On the ClusterControl server, install Apache, PHP, MySQL and other required components:


$ yum install httpd php php-mysql php-gd mysql-server mysql cronie sudo mailx -y


4. Download ClusterControl for MongoDB and required packages from Severalnines website:


$ wget http://www.severalnines.com/downloads/cmon/cmon-mongodb-controller-1.2.4-1.x86_64.rpm 
$ wget http://www.severalnines.com/downloads/cmon/cmon-mongodb-www-1.2.4-1.noarch.rpm 


5. Install ClusterControl web apps and create graph directory:


$ rpm -Uhv cmon-mongodb-www-1.2.4-1.noarch.rpm
$ mkdir/var/www/html/cmon/graph


6. Install the CMON controller:


$ rpm -Uhv cmon-mongodb-controller-1.2.4-1.x86_64.rpm


7. Disable name resolve in MySQL. This will allow us to use IP address only when granting database user. Add following line into /etc/my.cnf under [mysqld] directive:


skip-name-resolve


8. Enable auto-start on boot of MySQL, start MySQL, create CMON database and import the schema for CMON:


$ chkconfig mysqld on
$ service mysqld start
$ mysql -e“CREATE DATABASE cmon”
$ mysql </usr/share/cmon/cmon_db.sql
$ mysql </usr/share/cmon/cmon_data.sql


9. Enter MySQL console and allow CMON database users:


>GRANTALLON*.*TO'cmon'@'192.168.197.40' IDENTIFIED BY 'cmonP4ss'WITHGRANTOPTION;>GRANTALLON*.*TO'cmon'@'127.0.0.1' IDENTIFIED BY 'cmonP4ss'WITHGRANTOPTION;>GRANT SUPER,INSERT,SELECT,UPDATE,DELETEON*.*TO'cmon'@'192.168.197.41' IDENTIFIED BY 'cmonP4ss';>GRANT SUPER,INSERT,SELECT,UPDATE,DELETEON*.*TO'cmon'@'192.168.197.42' IDENTIFIED BY 'cmonP4ss';>GRANT SUPER,INSERT,SELECT,UPDATE,DELETEON*.*TO'cmon'@'192.168.197.43' IDENTIFIED BY 'cmonP4ss';


10. Configure MySQL root password:


$ mysqladmin -u root password ‘MyP4ss’
$ mysqladmin -h127.0.0.1 -u root password ‘MyP4ss’


11. Configure CMON as controller by editing /etc/cmon.cnf:


# CMON config file## id and name of cluster that this cmon agent is monitoring.## Must be unique for each monitored cluster, like server-id in mysqlcluster_id=1name=default_repl_1
mode=controller
type=mongodb
 
# MySQL for CMON## Port of mysql server holding cmon databasemysql_port=3306## Hostname/IP of mysql server holding cmon databasemysql_hostname=192.168.197.40
## Password for 'cmon' user on  the 'mysql_hostname'mysql_password=cmonP4ss
local_mysql_port=3306local_mysql_password=cmonP4ss
mysql_basedir=/usr/ 
# CMON service## Hostname/IP of the server of this cmon instancehostname=192.168.197.40
## ouser - the user owning the cmon_core_dir aboveosuser=root
os=redhat
## logfile is default to sysloglogfile=/var/log/cmon.log
## Location of cmon.pid file. The pidfile is written in /tmp/ by defaultpidfile=/var/run/nodaemon=0 
# MongoDB configdb locationmonitored_mountpoints=/var/lib/mongodb/configdb
## All mongodb instances with port (comma separated)mongodb_server_addresses=192.168.197.41:27018,192.168.197.42:27018,192.168.197.43:27018mongocfg_server_addresses=192.168.197.41:27019,192.168.197.42:27019,192.168.197.43:27019mongos_server_addresses=192.168.197.41:27017,192.168.197.42:27017,192.168.197.43:27017mongodb_basedir=/usr/ 
# CMON stats optionsdb_stats_collection_interval=10host_stats_collection_interval=60ssh_opts=-nq


Install ClusterControl Agents


ClusterControl agents must reside in all MongoDB nodes. The agents are responsible for the following:

  • Restarting failed processes
  • Collecting host stats (disk/network/CPU/RAM)
  • Reading and parsing log files


1. Login to mongo1 via SSH, download and install CMON MongoDB agent:


$ wget http://www.severalnines.com/downloads/cmon/cmon-mongodb-agent-1.2.4-1.x86_64.rpm
$ rpm -Uhv cmon-mongodb-agent-1.2.4-1.x86_64.rpm


2. Configure CMON as agent by editing /etc/cmon.cnf:

# CMON config file## id and name of cluster that this cmon agent is monitoring.## Must be unique for each monitored cluster, like server-id in mysqlcluster_id=1name=default_repl_1
mode=agent
type=mongodb
 
# MySQL for CMON## Port of mysql server holding cmon databasemysql_port=3306## Hostname/ip of mysql server holding cmon databasemysql_hostname=192.168.197.40
## Password for 'cmon' user on  the 'mysql_hostname'mysql_password=cmonP4ss
local_mysql_port=3306local_mysql_password=cmonP4ss
# CMON service## Hostname/IP of the server of this cmon instancehostname=192.168.197.41
## osuser - the user owning the cmon_core_dir aboveosuser=root
## logfile is default to sysloglogfile=/var/log/cmon.log
## location of cmon.pid file. The pidfile is written in /tmp/ by defaultpidfile=/var/run/nodaemon=0 
# MongoDB config databasemonitored_mountpoints=/var/lib/mongodb/configdb


3. Repeat above steps for mongo2 and mongo3. Make sure to change the value of “hostname” on the respective nodes.


Start the Cluster


1. We will begin by enabling Apache and CMON on boot, followed by starting Apache and CMON service in ClusterControl server:


$ chkconfig httpd on
$ chkconfig cmon on
$ service httpd start
$ service cmon start


2. Next, login to mongo1, mongo2 and mongo3 to start CMON agent service:


$ chkconfig cmon on
$ service cmon start


Configure ClusterControl UI


1. To install the new ClusterControl UI, SSH into the ClusterControl host, download the ClusterControl installation script, change script permissions and execute it:


$ wget http://www.severalnines.com/downloads/cmon/setup-cc-ui.sh
$ chmod +x setup-cc-ui.sh
$ ./setup-cc-ui.sh


2. To finalize the UI installation, open web browser and go to this URL, http://ClusterControl_IP_address/install and you should see “Install ClusterControl UI and API” page.


**Please note the ClusterControl API Access Token, ClusterControl API URL, your login email and login password. We will use these later on the cluster registration page.


3. After the installation, click “Click here to automatically register your cluster now!” and you will redirected to cmonapi page similar to screenshot below. Click “Login Now”.


4. After that, you need to login using the email address you specified in the installation page with respective password. (default is “admin”). You should see the “Cluster Registrations” page similar to screenshot below. Enter the ClusterControl API token and URL:


5. You will be redirected to ClusterControl UI located at http://ClusterControl_IP_address/clustercontrol, your MongoDB Cluster is listed on this page. Click on it to view your cluster:


You’re done! You are now able to manage your MongoDB sharded cluster using ClusterControl!

Blog category:

Turning MongoDB Replica Set to a Sharded Cluster

$
0
0

Replica Sets or Sharded Clusters?

** Diagrams updated on May 22nd. Thanks to Leif Walsh from Tokutek for his feedback.

Replica Sets are a great way to replicate MongoDB data across multiple servers and have the database automatically failover in case of server failure. Read workloads can be scaled by having clients directly connect to secondary instances. Note that master/slave MongoDB replication is not the same thing as a Replica Set, and does not have automatic failover.

Since replication is asynchronous, the data on secondary instances might not be the latest.


Sharding is a way to split data across multiple servers. In a MongoDB Sharded Cluster, the database will handle distribution of the data and dynamically load-balance queries. So, if you have a high write workload, then sharding is the way to go. MongoDB uses a shard key to split collections and migrate the ‘chunks’ to the correct shard.

It is important to pick a good shard key and avoid “hot spots”, so that data is evenly spread between shards and writes are also evenly distributed. In the picture below you see an example with two shards, each shard consists of a replica set.

Migration from a Replica Set to a Sharded setup is pretty easy, but should not be done when the system is busy. The splitting/migration of chunks creates extra load, and can bring a busy system to a standstill.

Additional configuration and routing processes are added to manage the data and query distribution. Config servers store the meta data for the sharded cluster, and are kept consistent by using a two phase commit. Routers are the processes that clients connect to, and queries are then routed to the appropriate shard.

Sharding does add some more complexity, since there are more processes to manage. However, if your performance is degrading and tuning of your application or your existing instances are not helping, then you probably need to look into sharding.


Deploying a Replica Set

We will deploy a replica set called rs0. This replica set will have as primary node mongo1 replicating to two secondary instances mongo2 and mongo3. Install MongoDB on all three servers. On each of MongoDB server, create a configuration file as below:

$ vim/etc/mongodb.conf

And add the following lines:

# /etc/mongodb.conf# mongod server config file
port = 27017
dbpath = /data/mongodb/
fork = true
replSet = rs0
logpath = /var/log/mongodb.log
logappend = yes

Create the Mongodb data directory:

$ mkdir-p/data/mongodb

Start the mongod process on every server:

$ mongod -f/etc/mongodb.conf

Connect to mongo shell and initiate replication on mongo1:

mongo> rs.initiate()

Add all replication members to the replica set:

mongo> rs.add(“mongo1:27017)
mongo> rs.add(“mongo2:27017)
mongo> rs.add(“mongo3:27017)

New replica sets elect a primary within a few seconds. Check the replication status:

mongo> rs.status()


Check the status until you see the syncingTo value:

"syncingTo":"mongo1:27017"

Import a test database from http://media.mongodb.org/zips.json into the replica set:

$ wget http://media.mongodb.org/zips.json
$ mongoimport --host rs0/mongo1:27017,mongo2:27017,mongo3:27017--db mydb --collectionzip--file zips.json

At the moment, we have a replica set (rs0) with a database (mydb) and a collection (zip) on 3 servers (mongo1, mongo2,mongo3).


Turning a Replica Set to a Sharded Cluster

In a Sharded Cluster, another 2 new roles will be added: mongos and mongod config. mongos is a routing service for MongoDB Sharded Clusters, it determines the location of the data in the cluster, and forwards operations to the right shard. mongos requires mongod config, which stores the metadata of the cluster. All mongos instances must specify the mongod config hosts to the --configdb setting in the same order, and the mongos will read from the first config server (if it cannot connect to the config server, it will move on to the next on the list).

Previously, our mongod replication instance listened on TCP port 27017. We are going to change this to listen to another port (27018) since mongos will take over port 27017 to serve queries from clients. mongod config will use port 27019 to serve the cluster metadata.


Convert mongod Instances to Shard Servers

We will now stop our mongod instances, change ports and activate sharding:

$ killall-9 mongod

To make configuration more simple, we will rename our configuration file from /etc/mongodb.conf to /etc/mongodb_shard.conf and add the following line:

# /etc/mongodb_shard.conf# mongodb shard with replica set config file
port = 27018
dbpath = /data/mongodb/
fork = true
shardsvr = true
replSet = rs0
logpath = /var/log/mongodb.log
logappend = yes


Deploy Config Server

Next, create a configuration file for mongod config, /etc/mongodb_config.conf and add the following lines:

# /etc/mongodb_config.conf# mongod configdb server config file
port = 27019
dbpath = /data/configdb/
fork = true
configsvr = true
logpath = /var/log/mongodb_config.log
logappend = yes

Make sure the mongod config data directory exists:

$ mkdir-p/data/configdb

Start the mongod config instance:

$ mongod -f/etc/mongodb_config.conf


Deploy mongos

Create another configuration file for mongos, /etc/mongos.conf and add the following lines:

# /etc/mongos.conf# mongos config file
port = 27017
configdb = mongo1:27019,mongo2:27019,mongo3:27019
fork = true
logpath = /var/log/mongos.log
logappend = yes

Start the mongos and mongod shard instances:

$ mongos -f/etc/mongos.conf
$ mongod -f/etc/mongodb_shard.conf


Change Replica Set port configuration

Our Replica Set is listening on port 27018. We need to change the replication setting on the primary mongod instance to this new port. Connect through mongo shell:

$ mongo mongo1:27018

And execute following command:

mongo> use local
mongo> cfg = db.system.replset.findOne({_id:"rs0"})
mongo> cfg.members[0].host="mongo1:27018"
mongo> cfg.members[1].host="mongo2:27018"
mongo> cfg.members[2].host="mongo3:27018"
mongo> db.system.replset.update({_id:"rs0"},cfg)

Verify the replication status:

mongo> rs.status()


Add Replica Set to Sharded Cluster

Add rs0 to our Shard Cluster by first connecting to mongos:

$ mongo

Then execute the following command:

mongo> sh.addShard("rs0/mongo1:27018,mongo2:27018,mongo3:27018");

Enable sharding on the database mydb that we imported earlier:

mongo> sh.enableSharding("mydb")

Verify the shard status:

mongo> sh.status()--- Sharding Status ---
  sharding version:{"_id":1,"version":3,"minCompatibleVersion":3,"currentVersion":4,"clusterId": ObjectId("51889fcbdf802ab88310f482")}
  shards:{"_id":"rs0","host":"rs0/mongo1:27018,mongo2:27018,mongo3:27018"}
  databases:{"_id":"admin","partitioned":false,"primary":"config"}{"_id":"mydb","partitioned":true,"primary":"rs0"}

Now, our replica set (rs0) is running as a shard in our Sharded Cluster.


Testing

Connect through any of the mongos, lets say mongo2:

$ mongo mongo2

And try to query some data on database mydb and collection zip:

mongo> use mydb
mongo> db.zip.find(){"city":"ACMAR","loc":[-86.51557,33.584132],"pop":6055,"state":"AL","_id":"35004"}{"city":"ADAMSVILLE","loc":[-86.959727,33.588437],"pop":10616,"state":"AL","_id":"35005"}{"city":"ADGER","loc":[-87.167455,33.434277],"pop":3205,"state":"AL","_id":"35006"}{"city":"KEYSTONE","loc":[-86.812861,33.236868],"pop":14218,"state":"AL","_id":"35007"}{"city":"NEW SITE","loc":[-85.951086,32.941445],"pop":19942,"state":"AL","_id":"35010"}{"city":"ALPINE","loc":[-86.208934,33.331165],"pop":3062,"state":"AL","_id":"35014"}{"city":"ARAB","loc":[-86.489638,34.328339],"pop":13650,"state":"AL","_id":"35016"}{"city":"BAILEYTON","loc":[-86.621299,34.268298],"pop":1781,"state":"AL","_id":"35019"}{"city":"BESSEMER","loc":[-86.947547,33.409002],"pop":40549,"state":"AL","_id":"35020"}{"city":"HUEYTOWN","loc":[-86.999607,33.414625],"pop":39677,"state":"AL","_id":"35023"}{"city":"BLOUNTSVILLE","loc":[-86.568628,34.092937],"pop":9058,"state":"AL","_id":"35031"}{"city":"BREMEN","loc":[-87.004281,33.973664],"pop":3448,"state":"AL","_id":"35033"}{"city":"BRENT","loc":[-87.211387,32.93567],"pop":3791,"state":"AL","_id":"35034"}{"city":"BRIERFIELD","loc":[-86.951672,33.042747],"pop":1282,"state":"AL","_id":"35035"}{"city":"CALERA","loc":[-86.755987,33.1098],"pop":4675,"state":"AL","_id":"35040"}{"city":"CENTREVILLE","loc":[-87.11924,32.950324],"pop":4902,"state":"AL","_id":"35042"}{"city":"CHELSEA","loc":[-86.614132,33.371582],"pop":4781,"state":"AL","_id":"35043"}{"city":"COOSA PINES","loc":[-86.337622,33.266928],"pop":7985,"state":"AL","_id":"35044"}{"city":"CLANTON","loc":[-86.642472,32.835532],"pop":13990,"state":"AL","_id":"35045"}{"city":"CLEVELAND","loc":[-86.559355,33.992106],"pop":2369,"state":"AL","_id":"35049"}
Type "it"for more


Congratulations, you have now converted your MongoDB replica set into replicated Sharded Cluster! To add monitoring and cluster management to your Sharded Cluster, you can follow this post to install ClusterControl for MongoDB.


Blog category:

On-premises Cluster Management and Monitoring of MongoDB Replica Set

$
0
0

Replica Sets in MongoDB are very useful. They provide multiple copies of data, automated failover and read scalability. A Replica Set can consist of up to 12 nodes, with only one primary node (or master node) able to accept writes. In case of primary node failure, a new primary is auto-elected.

It is advisable to have an odd number of nodes in a Replica Set, so as to avoid vote locking when a new primary node is being elected. Replica Sets require a majority of the remaining nodes present to elect a primary. If you have e.g. 2 nodes in a Replica Set, then one option is to add an arbiter. An arbiter is a mongod instance that is part of a Replica Set, but does not hold any data. Because of the minimal resource requirements, it can be colocated with an application server or the ClusterControl server. The arbiter should not be colocated with any of the members of the Replica Set.


In this post, we will show you how to install and configure a Replica Set, and then manage it using ClusterControl. It is similar to a previous post on how to manage and monitor a Sharded Cluster. Our hosts are running Debian Squeeze 64bit.

Note that you can also deploy a Replica Set using our MongoDB Configurator, this will automate the whole process.


Install MongoDB


**Following steps should be performed on mongo1, mongo2 and mongo3.


1. Import the 10gen public GPG Key:

$ apt-key adv--keyserver keyserver.ubuntu.com --recv 7F0CEB10


2. Create a /etc/apt/sources.list.d/10gen.list using following command:

echo‘deb http://downloads-distro.mongodb.org/repo/debian-sysvinit dist 10gen’ |tee/etc/apt/sources.list.d/10gen.list


2. Install MongoDB using package manager:

$ apt-get update&&apt-get install mongodb-10gen


3. Configure MongoDB for replication by adding following lines into /etc/mongodb.conf. Take note that our replica set name is defined as rs0:

# /etc/mongodb.confport=27017dbpath=/var/lib/mongodb
logpath=/var/log/mongodb/mongodb.log
logappend=truereplSet=rs0
rest=truepidfilepath=/var/run/mongodb/mongod.pid


4. Restart mongodb service to apply changes:

$ service mongodb restart


Configure Replica Set

1. Initiate replica set by login into mongo in mongo1:

$ mongo


And run following command:

> rs.initiate()


2. Add mongo2 into the replica set:

> rs.add("mongo2");


3. We need at least 3 members in a replica set in order to complete an election if 1 member goes down. Arbiter is a member of a replica set that exists solely to vote in elections. Arbiters do not replicate data. We are going to setup mongo3 as arbiter:

> rs.addArb("mongo3");


4. Check replica set status:

> rs.status()


You can also use the MongoDB REST interface which available at http://ip_address:28017/_replSet to check your replica set status similar to screenshot below:


Import Data into Replica Set


1. Import some test data into replica set which available at http://media.mongodb.org/zips.json:

$ wget http://media.mongodb.org/zips.json
$ mongoimport --host'rs0/mongo1,mongo2,mongo3'--db mydb --collectionzip--file zips.json


2. Check the imported data by connecting to mongo console and run following commands:

> use mydb
> db.zip.find()


Install ClusterControl Server - the automatic way


Here is the recommended way to get ClusterControl on top of your existing MongoDB replica set. We have built a collection of scripts available under Severalnines download page which will automate the bootstrapping process. You may refer to this knowledge base article for further details.


Install ClusterControl Server - the manual way

We will need a separate server to run ClusterControl, as illustrated below:


**Following steps should be performed on ClusterControl host.


1. It is highly recommended to enable passwordless SSH with key authentication between ClusterControl and agents. Generate a RSA key and copy it to all nodes:

$ ssh-keygen-t rsa # just press enter for all prompts
$ ssh-copy-id -i ~/.ssh/id_rsa 192.168.197.41
$ ssh-copy-id -i ~/.ssh/id_rsa 192.168.197.42
$ ssh-copy-id -i ~/.ssh/id_rsa 192.168.197.43
$ ssh-copy-id -i ~/.ssh/id_rsa 192.168.197.40


2. Install Apache, PHP, MySQL and other required components:

$ apt-get install apache2 php5-common php5-mysql php5-gd mysql-server mysql-client sudo mailutils -y


3. Download ClusterControl for MongoDB from Severalnines download site:

$ wget http://www.severalnines.com/downloads/cmon/cmon-1.2.4-64bit-glibc23-mongodb.tar.gz


4. Extract ClusterControl into /usr/local directory and create symlink to CMON path:

$ tar-xzf cmon-1.2.4-64bit-glibc23-mongodb.tar.gz -C/usr/local
$ ln-s/usr/local/cmon-1.2.4-64bit-glibc23-mongodb /usr/local/cmon


5. Copy the CMON binary, init and cron files into respective locations:

$ cp/usr/local/cmon/bin/*/usr/bin
$ cp/usr/local/cmon/sbin/*/usr/sbin
$ cp/usr/local/cmon/etc/cron.d/cmon /etc/cron.d
$ cp/usr/local/cmon/etc/init.d/cmon /etc/init.d


6. Copy the CMON web apps:

$ cp-rf/usr/local/cmon/www/*/var/www/


7. Disable bind-address and name resolve in MySQL. This will allow us to use IP address only when granting database user. Add following line into /etc/mysql/my.cnf under [mysqld] directive:

skip-name-resolve


And comment following line:

#bind-address


8. Restart MySQL to apply changes:

$ service mysql restart


9. Create CMON database and import the schema for CMON:

$ mysql -e“CREATE DATABASE cmon”
$ mysql </usr/local/cmon/sql/cmon_db.sql
$ mysql </usr/local/cmon/sql/cmon_data.sql


10. Enter MySQL console and allow CMON database users:

>GRANTALLON*.*TO'cmon'@'192.168.197.120' IDENTIFIED BY 'cmonP4ss'WITHGRANTOPTION;>GRANTALLON*.*TO'cmon'@'127.0.0.1' IDENTIFIED BY 'cmonP4ss'WITHGRANTOPTION;>GRANT SUPER,INSERT,SELECT,UPDATE,DELETEON*.*TO'cmon'@'192.168.197.121' IDENTIFIED BY 'cmonP4ss';>GRANT SUPER,INSERT,SELECT,UPDATE,DELETEON*.*TO'cmon'@'192.168.197.122' IDENTIFIED BY 'cmonP4ss';>GRANT SUPER,INSERT,SELECT,UPDATE,DELETEON*.*TO'cmon'@'192.168.197.123' IDENTIFIED BY 'cmonP4ss';


11. Configure MySQL root password:

$ mysqladmin -u root password ‘MyP4ss’
$ mysqladmin -h127.0.0.1 -u root password ‘MyP4ss’


12. Create CMON configuration file at /etc/cmon.cnf:

$ vim/etc/cmon.cnf


And add following lines:

# /etc/cmon.cnf - cmon config file# id and name of cluster that this cmon agent is monitoring.# Must be unique for each monitored cluster, like server-id in mysqlcluster_id=1name=default_repl_1
mode=controller
type=mongodb
 
##port of mysql server holding cmon databasemysql_port=3306 
##hostname/ip of mysql server holding cmon databasemysql_hostname=192.168.197.120
 
##password for 'cmon' user on  the 'mysql_hostname'mysql_password=cmonP4ss
local_mysql_port=3306local_mysql_password=cmonP4ss
 
##hostname/ip of the server of this cmon instancehostname=192.168.197.120
cmon_core_dir=/root/s9s
 
##osuser - the user owning the cmon_core_dir aboveosuser=root
os=debian
 
##logfile is default to syslog.logfile=/var/log/cmon.log
 
##location of cmon.pid file. The pidfile is written in /tmp/ by defaultpidfile=/var/run/nodaemon=0monitored_mountpoints=/var/lib/mongodb
mongodb_server_addresses=192.168.197.121:271017,192.168.197.122:27017mongoarbiter_server_addresses=192.168.197.123:27017mongodb_basedir=/usr
 
mysql_basedir=/usr
db_stats_collection_interval=10host_stats_collection_interval=60ssh_opts=-nqtt


Install ClusterControl Agent


ClusterControl agents must reside in all MongoDB nodes. The agents are responsible for the following:

  • Collecting host stats (disk/network/CPU/RAM)
  • Reading and parsing log files


** Following steps should be performed on mongo1, mongo2 and mongo3.


1. Download ClusterControl for MongoDB from Severalnines download site:

$ wget http://www.severalnines.com/downloads/cmon/cmon-1.2.4-64bit-glibc23-mongodb.tar.gz


2. Extract ClusterControl into /usr/local directory and create symlink to CMON path:

$ tar-xzf cmon-1.2.4-64bit-glibc23-mongodb.tar.gz -C/usr/local
$ ln-s/usr/local/cmon-1.2.4-64bit-glibc23-mongodb /usr/local/cmon


3. Copy the CMON binary and init files into locations:

$ cp/usr/local/cmon/bin/*/usr/bin
$ cp/usr/local/cmon/sbin/*/usr/sbin
$ cp/usr/local/cmon/etc/init.d/cmon /etc/init.d


4. Create CMON configuration file at /etc/cmon.cnf and add following lines:

# /etc/cmon.cnf - CMON config file## id and name of cluster that this cmon agent is monitoring.## Must be unique for each monitored cluster, like server-id in mysqlcluster_id=1name=default_repl_1
mode=agent
type=mongodb
 
# MySQL for CMON## Port of mysql server holding cmon databasemysql_port=3306## Hostname/ip of mysql server holding cmon databasemysql_hostname=192.168.197.120
 
## Password for 'cmon' user on  the 'mysql_hostname'mysql_password=cmonP4ss
local_mysql_port=3306local_mysql_password=cmonP4ss
 
## Hostname/IP of the server of this cmon instancehostname=192.168.197.121
 
## osuser - the user owning the cmon_core_dir aboveosuser=root
 
## logfile is default to sysloglogfile=/var/log/cmon.log
 
## location of cmon.pid file. The pidfile is written in /tmp/ by defaultpidfile=/var/run/nodaemon=0 
# MongoDB database pathmonitored_mountpoints=/var/lib/mongodb


5. Repeat above steps for mongo2 and mongo3. Make sure to change the value of “hostname” to the IP address of respective nodes.


Start the Service

** Following steps should be performed on mongo1, mongo2 and mongo3 followed by ClusterControl.


Enable the CMON service on boot and start the service in agent hosts, followed by controller host:

$ update-rc.d cmon start 992345 . stop 99016 .
$ service cmon start


Configure ClusterControl UI


** Following steps should be performed on ClusterControl host.


1. To install the new ClusterControl UI, SSH into the ClusterControl host, download the ClusterControl installation script, change script permissions and execute it:

$ wget http://www.severalnines.com/downloads/cmon/setup-cc-ui.sh
$ chmod +x setup-cc-ui.sh
$ ./setup-cc-ui.sh


2. To finalize the UI installation, open web browser and go to this URL, http://ClusterControl_IP_address/install and you should see “Install ClusterControl UI and API” page.

**Please note the ClusterControl API Access Token, ClusterControl API URL, your login email and login password. We will use these later on the cluster registration page.


3. After the installation, click “Click here to automatically register your cluster now!” and you will redirected to cmonapi page similar to screenshot below. Click “Login Now”.


4. After that, you need to login using the email address you specified in the installation page with respective password. (default is “admin”). You should see the “Cluster Registrations” page similar to screenshot below. Enter the ClusterControl API token and URL:


5. You will be redirected to ClusterControl UI located at https://ClusterControl_IP_address/clustercontrol, your MongoDB Cluster is listed on this page. Click on it to view your cluster:


You’re done! You are now able to manage your MongoDB Replica Set using ClusterControl. 

Blog category:

NoSQL Battle of the East Coast - Benchmarking MongoDB vs TokuMX Cluster

$
0
0

In this post we will compare performance of MongoDB and TokuMX, a MongoDB performance engine from Tokutek. We will conduct three simple experiments that (almost) anyone without any programming skills can try and reproduce. In this way, we’ll be able to see how both products behave.

Let’s first briefly cover the main differences between the official MongoDB server from 10gen MongoDB, Inc. (which we will refer to as MongoDB from now on) and TokuMX. The MongoDB server uses B-Trees, these have been around for 40 years. TokuMX uses a newer Fractal Tree Indexing technology, and behaves different in a several areas.


Transactions

TokuMX supports transactions with ACID and MVCC properties. Thus, you can make multiple reads and write operations in one transaction. If a read or write would fail in the transaction, the entire transaction is rolled back leaving the data in the state it was in before the transaction was started.

MongoDB also has transaction support, but for each individual operation — writes are atomic, which means you can make 10 writes, and if the 5th write fail, the writes before will not be rollbacked, and the writes following may succeed.

Locking

TokuMX has document-level locking and MongoDB has database-level locking (in relational databases this is like row-level locking vs table-level locking). Document-level locking is better for multi-threaded applications with a mix of read and writes because the locking granularity is on the document. Since MongoDB locks on the database level only one write at a time can be executed on the database (it is an exclusive lock), and no other read or write operation can share this lock. Writes take precedence over readers. What this means for TokuMX is that you don’t have to shard your data in order to scale a concurrent workload. At least, not as early as you would do for MongoDB.

Compaction/Defragmentation

In MongoDB, updates changing the size of the document will cause fragmentation and you need to run compaction and defragmentation procedures. Since compaction is blocking, you have  to compact the SECONDARYs first and then make a SECONDARY the PRIMARY, so that the old PRIMARY can be compacted using the compact command. Having to shutdown the PRIMARY in a production system in order to compact it will make the Replica Set unavailable for a short period of time.

TokuMX manages data differently and stores information in Fractal Tree Indexes. Fractal Tree indexes does not get fragmented, so no compaction or index rebuilds are needed. This sounds very promising. Generally, the less you have to touch a running system the better it is.

Memory Management

MongoDB uses memory-mapped files for storing data. The size of the memory mapped files may be larger than what you have in RAM. Writes are written to a journal as often as specified by journalCommitInterval (defaults to 100ms in the test setup used here, but a write can be forced to be immediately written to the journal). Data pages are lazily written to storage and controlled by syncDelay (default 60s). It is of course possible to make MongoDB explicitly fsync the pending writes to disk storage. In any case, the journal is used to recover in the event of a crash. This makes Mongodb crash safe.

In MongoDB, if a document is not available in RAM, then the page must be fetched from disk. This will cause a page fault. If page faults are increasing then performance will suffer. Since hard page faults forces the OS to pull data from disk, and push out pages from RAM to disk in order to make room. The bottom line is that you are in the hands of the merciful (hopefully) Operating System. It decides what should paged in and out.

In TokuMX, Tokutek has stripped out the MongoDB storage code and replaced it with its own storage code that uses Fractal Tree Indexes. Moreover, it allocates a cache. The cache is set to 50% by default of system memory. Exactly how the cache is managed is a bit of a mystery, so it would be great if Tokutek could shed some light here. But there is a clock algorithm, and in essence individual 64KB blocks of a node (4MB on disk) can be cached in RAM.  The main point here is that, since TokuMX manages what data should be in the cache then it can make better decisions on what pages should be in RAM and which should be on disk. Moreover, data is checkpointed (default every 60 seconds counted from the last completed checkpoint) from the cache to the data files on disk. When the checkpoint has finished the transaction log (tokulog files in the mongodb datadir) can be cleaned.

There are more differences between TokuMX and MongoDB, but let’s settle with the above and move on to our experiments.


Test System for Benchmark


The test system consisted of:

  • 3 servers for application (mongo clients)
  • 3 mongos servers 
  • 3 config servers
  • 1 shard (replica set) with 3 shard servers

Config servers and mongos are co-located on three servers. The shard servers run on designated instances.

All instances used in the test reside on Rackspace and have the same specs:

  • Ubuntu 12.04 x86_64
  • 2GB RAM
  • 80GB hard disk
  • 4 cores (Quad-Core AMD Opteron(tm) Processor 2374 HE 2200.088MHz)

The instances are not very powerful, but the dataset and experiments are the same for both MongoDB and TokuMX. In a production system, you would probably have more powerful instances and disk subsystem, but data sets are then usually bigger too.

Both the TokuMX cluster and the MongoDB cluster was created on exactly the same instances, and the cluster was setup and deployed with Severalnines Configurator.

The experiments we run are very simple and tests very basic primitives:

  • Experiment 1 - Insertion of 10M documents from one client into an empty cluster
  • Experiment 2 - Concurrency test (read + write) with one to six clients
  • Experiment 3 - Read test (exact match) with one to six clients

We never sharded the collection in any of the experiments because we did not want to exercise the mongos or the config servers. We connected the clients directly on the PRIMARY of the replica set.

In addition to ClusterControl, we also deployed MMS agents to compare the monitoring data. For MMS we used a default configuration (as recommended by 10gen MongoDB, Inc.) with the default collection_interval is 56 seconds. The collection interval for ClusterControl was set to 5 seconds for database stats, and 10 seconds for host stats (RAM, CPU, DISK, NET).


Experiment 1a: Insertion of 10M Documents


Insertion of 10M documents from one client. This is not a bulk-loading case (then we should configure differently), but this experiment can be applicable to e.g a click stream or a stream of financial data.

The idea here is to see how MongoDB and TokuMX behave over time. The dataset of 10M records does not fit in RAM.

my_mongodb_0:PRIMARY> db.johan.ensureIndex({x:1})
my_mongodb_0:PRIMARY>function insertData(dbName, colName, num){var col = db.getSiblingDB(dbName).getCollection(colName);  print(Math.round(new Date().getTime()/1000));for(i =0; i < num; i++){     data=createRandomData(200); col.insert({x:i, y:data});}     print(Math.round(new Date().getTime()/1000)); print(col.count());}
my_mongodb_0:PRIMARY> insertData('test','johan',10000000)


The storage required for the 10M documents are as follows:

TokuMX (using default compression):

$ du-sh/var/lib/mongodb/
4.7G	/var/lib/mongodb/

MongoDB:

$ du-sh/var/lib/mongodb/
9.6G	/var/lib/mongodb/


MongoDB

Average: 11600 inserts per second.


When looking at it from MMS the opcounters graph looks like the following:

Thus resolution is important to spot problems. The MMS agent is using the default settings (as recommended) and from this perspective everything looks great.

Looking at the opcounters graph from ClusterControl there are a few sharp drops visible. Look at e.g 07:40 and map it to 07:40 on the following graph showing disk stats:

From time to time there are huge spikes in disk writes. This causes IOWAIT to increase and USR CPU time to go down. Most likely it is the Linux VM flushing the dirty pages in RAM to disk.


TokuMX

For all the tests we have used default values for pageSize and compression=zlib.

Average: 13422 inserts per second.


Disk writes during the experiment are stable during the experiment. At the end there is a peak of disk reads and cache evictions which comes from db.collection.count().

And finally opcounters as seen by MMS:


Experiment 1b: Insertion of 20M Documents


MongoDB

Test failed - The SECONDARYs started to lose heartbeats, and the system was unstable. 

Thu Aug 22 12:10:23.101 [rsHealthPoll] replset info 10.178.134.223:27018 heartbeat failed, retrying
Thu Aug 22 12:10:23.101 [conn200] query local.oplog.rs query: { ts: { $gte: Timestamp 1377172513000|11630 } } cursorid:11842265410064867 ntoreturn:0 ntoskip:0 nscanned:102 keyUpdates:0 numYields: 20019 locks(micros) r:43741975 nreturned:101 reslen:31128 102082ms
Thu Aug 22 12:10:23.105 [conn203] SocketException handling request, closing client connection: 9001 socket exception [2] server [10.178.134.223:60943]
Thu Aug 22 12:10:23.107 [conn200] SocketException handling request, closing client connection: 9001 socket exception [2] server [10.178.134.223:60940]
Thu Aug 22 12:10:23.127 [conn204] query local.oplog.rs query: { ts: { $gte: Timestamp 1377172513000|11630 } } cursorid:11842351062395209 ntoreturn:0 ntoskip:0 nscanned:102 keyUpdates:0 numYields: 19479 locks(micros) r:29105064 nreturned:101 reslen:1737 72012ms
Thu Aug 22 12:10:24.109 [rsHealthPoll] DBClientCursor::init call() failed
Thu Aug 22 12:10:24.109 [rsHealthPoll] replSet info 10.178.134.223:27018 is down (or slow to respond):
Thu Aug 22 12:10:24.109 [rsHealthPoll] replSet member 10.178.134.223:27018 is now in state DOWN


Thu Aug 22 12:20:26.441 [rsBackgroundSync] replSet error RS102 too stale to catch up, at least from 10.178.0.69:27018
Thu Aug 22 12:20:26.441 [rsBackgroundSync] replSet our last optime : Aug 22 12:00:20 5215fd54:121a
Thu Aug 22 12:20:26.441 [rsBackgroundSync] replSet oldest at 10.178.0.69:27018 : Aug 22 12:10:14 5215ffa6:173d
Thu Aug 22 12:20:26.441 [rsBackgroundSync] replSet See http://dochub.mongodb.org/core/resyncingaverystalereplicasetmember
Thu Aug 22 12:20:26.441 [rsBackgroundSync] replSet error RS102 too stale to catch up


The SECONDARYs then changed state to RECOVERING. This happened during three test runs so we gave up.


TokuMX

Average: 12812 inserts per second.


Experiment 2: Random Read + Update Test (Concurrency)


In this test we want to look at concurrency.

Restarted with an empty cluster. First we insert 1M records, enough so we are sure the data set fits in RAM (we don’t want to test the disks, they are not very fast and we would soon become IO bound). 

Then we find a random record and update it which means there are 50% reads and 50% writes.

The read and write are not executed as one transaction in the case of TokuMX.

my_mongodb_0:PRIMARY>function readAndUpdate(dbName, colName, no_recs, iter){var col = db.getSiblingDB(dbName).getCollection(colName);var doc=null; print(Math.round(new Date().getTime()/1000));for(i =0; i < iter; i++){ rand=Math.floor((Math.random()*no_recs)+1);   doc=col.findOne({x:rand},{y:1});if(doc==null)continue; y=doc.y; new_y=y+rand; 
col.update({x:rand},{ $set:{y: new_y }});}     print(Math.round(new Date().getTime()/1000));}
my_mongodb_0:PRIMARY> readAndUpdate('test','johan',1000000,10000000)


MongoDB

Max throughput: 3910 updates per second.


Sudden performance drops are coming from filesystem writes, where IOWAIT shoots up, USR goes down, and disk writes goes up (as seen on the PRIMARY node):


TokuMX

Max throughput : 4233 updates per second.

Please note that the ‘updates’ in the graph above completely shadows the ‘queries’.

Also if you look carefully, you can see the graph drops every minute. These drops are caused by Checkpointing.

With five and six clients the throughput starts to fluctuate a bit. Luckily, TokuMX provides counters to understand what is going on. In the picture below we are graphing Cache Evictions, Cache Misses, and Cache Prefetches. A Cache Miss means TokuMX has to go to disk to fetch the data. A Cache Eviction means that a page is expired from the Cache. In this case, a faster disk and a bigger Cache would have been useful.


Clearly, letting the document level locking and having the database decide when to write to disk, as opposed to a mixture of the OS flushing the FS cache (and MongoDB syncing every 60 seconds), gives more predictable performance with TokuMX.


Experiment 3: Read Test


Same data set as in Experiment 2. Starting up to six clients. 


MongoDB

Max throughput: 8516 reads per second.


TokuMX

Max throughput: 8104 reads per second.


Appendix: Configuration


MongoDB - replica set members configuration

dbpath = /var/lib/mongodb
port = 27018
logappend = truefork=true
replSet = my_mongodb_0
noauth = truenssize=16directoryperdb=false
cpu = false
nohttpinterface = true
quiet = falsejournal=truejournalCommitInterval=100syncdelay=60


TokuMX - replica set members configuration

dbpath = /var/lib/mongodb
port = 27018
logappend = true
cacheSize = 1073741824
logFlushPeriod = 100
directio = off
cleanerPeriod = 2
cleanerIterations = 5
fsRedzone = 5
lockTimeout = 4000
expireOplogDays = 5fork=true
replSet = my_mongodb_0
noauth = truenssize=16
cpu = false
nohttpinterface = true
quiet = falsesyncdelay=60


Blog category:

OpenStack Metering: How to Install Ceilometer with MongoDB

$
0
0

According to Wikipedia, a ceilometer is a device that uses a laser or other light source to determine the height of a cloud base. And it is also the name of the framework for monitoring and metering OpenStack. It collects measurements within OpenStack so that no two agents would need to be written to collect the same data. 

Ceilometer collects metering data (CPU, network costs) that can be used for billing purposes with Openstack. Because it requires a lot of writes, the preferred database is MongoDB. Although there are drivers for other database backends, the storage driver for MongoDB is considered feature-complete at this time and therefore recommended for production usage.

In this post we are going to show you how to deploy a minimal MongoDB replica set (two MongoDB instances) and install Ceilometer services on OpenStack’s controller and compute nodes. This example assumes that we already have an OpenStack controller and a compute node running on Ubuntu Precise with three additional nodes specifically for MongoDB and ClusterControl.

Our architecture is illustrated as follows:

Our hosts definitions on every hosts are as below:

192.168.10.101	controller
192.168.10.102	compute1
192.168.10.110	clustercontrol
192.168.10.111	mongo1
192.168.10.112	mongo2


Deploying MongoDB Replica Set

1. We will use the MongoDB Configurator to deploy a Replica Set consisting of two MongoDB instances. The following options have been used for the deployment package:

Configuration        : Single Replicaset

Vendor               : 10gen

Number of mongod in each replica set: 2 mongod

OS user              : Ubuntu

Use ‘smallfiles’     : yes

ClusterControl server: 192.168.197.110

Mongo Servers        : 1) 192.168.197.111

                       2) 192.168.197.112


2. Download the deployment package into the ClusterControl node and start the deployment:

$ wget http://www.severalnines.com/mongodb-configurator/tmp/cuqoedm36jncj1udjqrn6avuh6/s9s-mongodb-10gen-1.0.0.tar.gz
$ tar-xzf s9s-mongodb-10gen-1.0.0.tar.gz
$ cd s9s-mongodb-10gen-1.0.0/mongodb/scripts/install/
$ bash ./deploy.sh 2>&1|tee cc.log

3. Once the deployment is complete, register the MongoDB Replica Set with ClusterControl UI. Open http://192.168.197.110/cmonapi and enter the API token and CMONAPI URL. Once registered, you should see a mongodb database appears in the UI dashboard page, similar to screenshot below:

The database platform is ready and we can now proceed to install Ceilometer services.

Note: You might also consider to add a MongoDB arbiter to your Replica Set to maintain reliable quorum. For instance, to deploy an arbiter on the ClusterControl Server, make sure to install MongoDB server packages beforehand and use following command to add the arbiter into the current replica set from the ClusterControl node:

$ sudo s9s_mongodb_admin --add-arbiter-i1-N my_mongodb_0 -h 192.168.197.110 -P30000-d/var/lib/mongodb

Once done, the arbiter node should listed under Nodes page:


Installing Ceilometer

Controller Node

1. Add MongoDB repository into /etc/apt/sources.list:

$ echo“deb http://downloads-distro.mongodb.org/repo/ubuntu-upstart dist 10gen” |sudotee-a/etc/apt/sources.list

2. Install Ceilometer services and mongodb-clients on the OpenStack controller node:

$ sudoapt-get install ceilometer-api ceilometer-collector ceilometer-agent-central python-ceilometerclient mongodb-clients

3. Edit the connection string to use mongodb in /etc/ceilometer/ceilometer.conf under [database] section. Make sure you specify the PRIMARY mongod instance (as in this case is mongo1):

[database]connection=mongodb://ceilometer:ceilometerpassword@mongo1:27017/ceilometer

4. Generate a shared secret key:

$ openssl rand -hex10
73e3bcb910df888c11e1

And replace the value for metering_secret under [publisher_rpc] section in /etc/ceilometer/ceilometer.conf:

[publisher_rpc]metering_secret=73e3bcb910df888c11e1

5. Create a ceilometer user to authenticate with Keystone. Use the service tenant and assign user with admin role:

$ keystone user-create --name=ceilometer --pass=ceilometerpassword --email=ceilometer@email.com
$ keystone user-role-add --user=ceilometer --tenant=service --role=admin

6. Define the Keystone authentication token at /etc/ceilometer/ceilometer.conf by adding the following lines under the [keystone_authtoken] section:

[keystone_authtoken]
auth_host = controller
auth_uri = http://controller:35357/v2.0
auth_protocol = http
admin_tenant_name = service
admin_user = ceilometer
admin_password = ceilometerpassword

7. Register the ceilometer service with Keystone and take note of the id generated as we will need it in the next step:

$ keystone service-create --name=ceilometer --type=metering --description="Ceilometer Metering Service"
+-------------+----------------------------------+
|   Property  |              Value               |
+-------------+----------------------------------+
| description |   Ceilometer Metering Service    ||id| 8a6d406fe08042d5a1ac5793dc46fc69 ||     name    |            ceilometer            ||type|             metering             |
+-------------+----------------------------------+

8. Create the endpoint for ceilometer services. Use the --service-id value generated in the previous command: 

$ keystone endpoint-create \
  --service-id=8a6d406fe08042d5a1ac5793dc46fc69 \
  --publicurl=http://controller:8777/ \
  --internalurl=http://controller:8777/ \
  --adminurl=http://controller:8777/

9. Let’s create a mongodb database and user for ceilometer. Firstly connect to mongo1 using the mongo client:

$ mongo --host mongo1

And execute following queries:

my_mongodb_0:PRIMARY> use ceilometer
my_mongodb_0:PRIMARY> db.addUser({ user:"ceilometer", pwd:"ceilometerpassword", roles:["readWrite","dbAdmin"]})

10. Restart ceilometer services:

$ sudo service ceilometer-agent-central restart
$ sudo service ceilometer-api restart
$ sudo service ceilometer-collector restart

Compute Node

1. In this example, we just have a compute node used to run instances. So we are going to install the ceilometer agent package for nova compute. To add other service agents for metering services, please refer to Havana documentation:

$ sudoapt-get install ceilometer-agent-compute

2. Configure Nova with metering services by adding the following lines into /etc/nova/nova.conf under [default] section:

instance_usage_audit=True
instance_usage_audit_period=hour
notify_on_state_change=vm_and_task_state
notification_driver=nova.openstack.common.notifier.rpc_notifier
notification_driver=ceilometer.compute.nova_notifier

3. Add the same shared secret key into /etc/ceilometer/ceilometer.conf:

[publisher_rpc]metering_secret=73e3bcb910df888c11e1

4. Restart ceilometer-agent and nova-compute: 

$ sudo service ceilometer-agent-compute restart
$ sudo service nova-compute restart


Log into the Horizon dashboard and you should able to see ceilometer has been enabled under System Info:


After a few minutes, verify that the Ceilometer services have started to insert data into the ceilometer database. The following summary can be retrieved from ClusterControl’s Overview page:


Deploying Ceilometer with MongoDB Sharded Cluster

As your OpenStack infrastructure expands, expect metering collections and your MongoDB dataset to grow. You should then look into moving your Replica Set to a Sharded Cluster topology. There are several ways to achieve this, either convert the Replica Set to a Sharded Cluster or manually export the data set to a new MongoDB Sharded Cluster. You can easily deploy a Sharded Cluster using the MongoDB Configurator.

References

Blog category:

Installing ClusterControl on Existing MongoDB Replica Set using bootstrap script

$
0
0

So, your development project has been humming along nicely on MongoDB, until it was time to deploy the application. That's when you called your operations person and things got uncomfortable. NoSQL, document database, collections, replica sets, sharding, config servers, query servers,... What the hell's going on here?

It should not be a surprise for an ops person to question the use of a new database system. Monitoring the health of systems and ensuring they perform optimally are what operations folks do. Time will need to be spent on understanding this new database works, how to deploy so as to avoid or minimize problems, what to monitor, how to perform backups, how to add capacity and how to repair or recover the cluster when things really go wrong.

MMS is a free SaaS solution from MongoDB Inc. to monitor system metrics (1 minute resolution) and send email alerts upon failures. Recently, a cloud backup feature was added.

ClusterControl is an on-premise tool with combined monitoring, cluster management and deployment functionality. It provides high granularity monitoring data (down to 1 second resolution), providing sufficient depth of information to support detailed analysis and optimization activities.

It is possible to run both MMS and ClusterControl on your existing MongoDB or TokuMX cluster. You can see how the graphs compare in this blog post.

In this post, we are going to show on how to install ClusterControl on top of your existing MongoDB/TokuMX Replica Set using the bootstrap script. Note that you are able to colocate ClusterControl with any of the mongod instances.


Requirement

Prior to this installation, whether it is Replica Set or Sharded Cluster, make sure your MongoDB or TokuMX instances meet the following requirements:

  • ClusterControl requires every mongod instance to have an associate PID file. This includes shardsvr, configsvr, mongos, and arbiter. To define a PID file, use --pidfilepath variable or pidfilepath option in the configuration file. Starting from version 1.2.5, ClusterControl is able to detect PID even without specifying pidfilepath.
  • All MongoDB binaries must be installed on each node identically under one of the following paths:
    • /usr/bin
    • /usr/local/bin
    • /usr/local/mongod/bin
    • /opt/local/mongodb
  • MongoDB Replica Set/Sharded Cluster has been configured as a cluster. Verify this with sh.status() or rs.status() command.
  • Ensure that the designated ClusterControl node meets the hosts requirement.


Architecture

We have a three-node MongoDB Replica Set (one primary, one secondary and one arbiter) running on Ubuntu 12.04. All mongod instances have been installed through 10gen apt repository. ClusterControl controller will be installed on mongo3 so this is where we will perform the installation. mongo3 is configured as an arbiter to the replica set.


Let’s verify our replica set to make sure it meets the requirements. We will need to configure MongoDB to generate a PID file by adding following line into /etc/mongodb.conf:

pidfilepath=/var/lib/mongodb/mongodb.pid

Restart MongoDB to apply the change:

$ service mongodb restart

To verify the pidfilepath, you can use following command to concatenate the PID file (it should report the PID number):

$ cat/var/lib/mongodb/mongodb.pid
39101

Or use following command line via mongo client:

rs0:PRIMARY> db.runCommand("getCmdLineOpts");

Check the MongoDB binaries path. You can use whatever methods to detect path such as locatecommand -v or find:

$ sudoupdatedb
$ locate mongo |grep bin
/usr/bin/mongo
/usr/bin/mongod
/usr/bin/mongodump
/usr/bin/mongoexport
/usr/bin/mongofiles
/usr/bin/mongoimport
/usr/bin/mongooplog
...

Verify the replica set is configured properly:

rs0:PRIMARY> rs.status(){"set":"rs0","date": ISODate("2014-01-09T12:23:59Z"),"myState":1,"members":[{"_id":0,"name":"mongo1:27017","health":1,"state":1,"stateStr":"PRIMARY","uptime":84,"optime": Timestamp(1389270224,1),"optimeDate": ISODate("2014-01-09T12:23:44Z"),"self":true},{"_id":1,"name":"mongo2:27017","health":1,"state":2,"stateStr":"SECONDARY","uptime":27,"optime": Timestamp(1389270224,1),"optimeDate": ISODate("2014-01-09T12:23:44Z"),"lastHeartbeat": ISODate("2014-01-09T12:23:58Z"),"lastHeartbeatRecv": ISODate("2014-01-09T12:23:58Z"),"pingMs":1,"syncingTo":"mongo1:27017"},{"_id":2,"name":"mongo3:27017","health":1,"state":7,"stateStr":"ARBITER","uptime":15,"lastHeartbeat": ISODate("2014-01-09T12:23:58Z"),"lastHeartbeatRecv": ISODate("2014-01-09T12:23:58Z"),"pingMs":1}],"ok":1}

Installing ClusterControl

1. On mongo3, get the bootstrap script ready for installation:

$ wget http://severalnines.com/downloads/cmon/cc-bootstrap.tar.gz
$ tar zxvf cc-bootstrap.tar.gz
$ cd cc-bootstrap-*

2. Start the installation:

$ ./s9s_bootstrap --install

3. Follow the configuration wizard accordingly (example as below):

=============================================
   ClusterControl Bootstrap Configurator
=============================================
 
Is this your Controller host IP, 192.168.197.183 [Y/n]:
 
ClusterControl requires an email address to be configured as super admin user.
What is your email address [user@domain.com]: admin@email.com
 
What is your username [ubuntu] (e.g, ubuntu or root for RHEL):
We presume that all hosts in the cluster are running on the same OS distribution.
 
ClusterControl needs to use a shared key to perform installation and management on all hosts.
Where is your SSH key? (it will be generated if not exist) [/home/ubuntu/.ssh/id_rsa]:
 
What is your SSH port? [22]:
We presume all hosts in the cluster are running on the same SSH port.
 
ClusterControl needs to have a directory for installation purposes.
Enter a directory that will be used during this installation [/home/ubuntu/s9s]:
 
What is your database cluster type [galera] (mysqlcluster|replication|galera|mongodb): mongodb
** MongoDB Replica Set: Minimum 3 nodes (with arbiter) are required (excluding ClusterControl node).
** MongoDB Sharded Cluster: Minimum 3 nodes are required (excluding ClusterControl node).
 
What type of MongoDB cluster do you have [replicaset] (replicaset|shardedcluster):
Specify MongoDB arbiter instances if any (ip:port) [] (white space separated): 192.168.197.183:27017
Where are your MongoDB shardsvr/replSet instances (ip:port) [ip1:27017 ip2:27017 ... ipN:30000] (white space separated): 192.168.197.181:27017 192.168.197.182:27017
Where are your cluster data dbpath directories [] (white space separated:/mnt/<dir1> /mnt/<dir2>): /data/db
 
ClusterControl requires MySQL server to be installed on this host. Checking for MySQL server on localhost..
Found a MySQL server.
Enter the MySQL root password for this host [password]:
 
ClusterControl will create a MySQL user called 'cmon' to perform management, monitoring and automation tasks.
Enter the user cmon password [cmon]: cmonP4ss
 
Checking for Apache and PHP5..
Found Apache and PHP binary.
 Where do you want ClusterControl web app to be installed to? [/var/www]:
 
=========================================================================
Configuration is now complete. You may proceed to install ClusterControl.
=========================================================================

4. Wait until the deployment completes. You will see the following if the installation is successful:

=================================================
### CLUSTERCONTROL INSTALLATION COMPLETED. ###
Kindly proceed to register your cluster with following details:
URL      : https://192.168.197.183/cmonapi
Username : admin@email.com
Password : admin
 
ClusterControl API Token, 806132dcc3d04ac5bc531279cd943e03264ad305
ClusterControl API URL, https://192.168.197.183/cmonapi
=================================================

5. Register the cluster by pointing your web browser to the ClusterControl API URL. Click “Login Now” and log into ClusterControl using the default username and password. You will then be redirected to the Cluster Registrations page. Enter the ClusterControl API Token generated for this installation, similar to screenshot below:

Click “Register”. You should able to see your MongoDB Replica Set in the ClusterControl UI:


Post-Installation

From the ClusterControl UI, you can click the “Help” menu (located on top of the page) for a product tour. This is a quick way of getting to know the functionality available on the current page. 

If you encounter any problems during the installation process, or have any questions, please visit our Support portal at http://support.severalnines.com/.

Congratulations, you’ve now got cluster management for your existing MongoDB/TokuMX Replica Set!

Blog category:

Big Data Integration & ETL - Moving Live Clickstream Data from MongoDB to Hadoop for Analytics

$
0
0

MongoDB is great at storing clickstream data, but using it to analyze millions of documents can be challenging. Hadoop provides a way of processing and analyzing data at large scale. Since it is a parallel system, workloads can be split on multiple nodes and computations on large datasets can be done in relatively short timeframes. MongoDB data can be moved into Hadoop using ETL tools like Talend or Pentaho Data Integration (Kettle).

In this blog, we’ll show you how to integrate your MongoDB and Hadoop datastores using Talend. We have a MongoDB database collecting clickstream data from several websites. We’ll create a job in Talend to extract the documents from MongoDB, transform and then load them into HDFS. We will also show you how to schedule this job to be executed every 5 minutes.

Test Case

We have an application collecting clickstream data from several websites. Incoming data is mostly inserts generated from user actions against HTML Document Object Model (DOM) and stored in a MongoDB collection called domstream. We are going to bulk load our data in batch from the MongoDB collection into Hadoop (as an HDFS output file). Hadoop can then be used as a data warehouse archive on which we can perform our analytics. 

For step by step instructions on how to set up your Hadoop cluster, please read this blog post. Our architecture can be illustrated as below:

Our goal is to bulk load the MongoDB data to an HDFS output file every 5 minutes. The steps are:

  1. Install Talend
  2. Design the job and workflow
  3. Test
  4. Build the job
  5. Transfer the job to MongoDB server (ETL server)
  6. Schedule it to run in production via cron

Install Talend Open Studio

We’ll be using Talend Open Studio for Big Data as our ETL tool. Download and install the application on your local workstation. We'll use it to design and deploy the process workflow for our data integration project.

Extract the downloaded package and open the application. Accept the license and create a new project called Mongo2Hadoop. Choose the corresponding project and click Open. You can skip the TalendForge sign-in page and directly access the Talend Open Studio dashboard. Click on Job under Create a new section and give the job a name. We are going to use the same name with project name.

This is what you should see once the job is created:

MongoDB to Hadoop

Talend Open Studio has several components that can help us achieve the same goal. In this post, we will focus on a basic way and use only a few components to accomplish our goal. Our process workflow will look like this:

  1. Load checkpoint value (timestamp) from checkpoint.txt. This is the timestamp of the latest document that was transferred from MongoDB.
  2. Connect to MongoDB.
  3. Read the timestamp of the latest document, export it as context.end and output it to checkpoint.txt.
  4. Read all documents between the checkpoint value and context.end.
  5. Export the output to HDFS.

The above process is represented in following flowchart:


Load Checkpoint Value

Let’s start designing the process. We will create several subjobs to form a MongoDB to Hadoop data integration job. The first subjob is loading up the checkpoint value from an external file.

Under Palette tab, drag tFileList, tFileInputDelimited and tContextLoad into the Designer workspace. Map them together as a subjob similar to following screenshot:


Specify the component’s option under Component tab as below:


Component

Settings

tFileList_1

  • Under Files click ‘+’ and add “checkpoint.txt” (with quote)

tFileInputDelimited_1

  • Under File name/Stream field, delete the default value and press Ctrl + Spacebar on keyboard. Choose “tFileList_1.CURRENT_FILEPATH”. The generated value would be:

    ((String)globalMap.get("tFileList_1_CURRENT_FILEPATH"))

  • Check ‘Die on error’

  • Click ‘Edit schema’ and add 2 columns:

    • key

    • value

tContextLoad_1

  • Check ‘Die on error’


Create a default file under tFileList workspace directory called checkpoint.txt. Insert following line and save:

checkpoint;0

This indicates the starting value that the subjob will use, when reading from our MongoDB collection. The value 0 will be updated by the next subjob after it has read the timestamp of the latest document in MongoDB. In this subjob, we define tFileList to read a file called checkpoint.txt, and tFileInputDelimited will extract the key value information as below:

  • key=checkpoint
  • value=0

Then, tContextLoad will use those information to set the value of context.checkpoint to 0, which will be used in other subjobs.

Read the Latest Timestamp

Another subjob is to read the latest timestamp from the domstream collection, export it to an external file and as a variable (context.end) to be used by the next subjob.


Add tMongoDBConnection, tSendMail, tMongoDBInput, tMap, tFileOutputDelimited and tContextLoad into the Designer workspace. Map them together as below:

tMongoDBConnection_1

This component initiates the connection to MongoDB server to be used by the next subjob. If it fails, Talend will send a notification email through the tSendMail component. This is optional and you may configure tSendMail with an SMTP account.

Specify the MongoDB connection parameters as below:

  • DB Version: MongoDB 2.5.X
  • Server: "192.168.197.40"
  • Port: "27017"
  • Database: "clickstream"

tMongoDBInput_1

Read the latest timestamp from the MongoDB domstream collection. Specify the component options as per below:

1. Check Use existing connection and choose tMongoDBConnection_1 from the dropdown list.

2. Collection: "domstream"

3. Click on the Edit schema button and add a column named timestamp (in this subjob, we just want to read the timestamp value), similar to the screenshot below:

4. Query: "{},{timestamp:1, _id:0}"

5. Sort by: "timestamp" desc

6. Limit: 1

Note that we need to add an index in descending sort order to the timestamp field in our domstream collection. This allows for faster sort when retrieving the latest timestamp. Run the following command in mongo shell:

db.domstream.ensureIndex({timestamp:-1})

(You can also replicate the data from the oplog rather than from the actual domstream collection, and make use of opTime. This saves you from indexing the timestamp field in domstream. More on this in a future blogpost.)

tMap_1

Transform the timestamp value to a key/value pair (out_file) and job context (out_context). Double click on the tMap_1 icon and configure the output mapping as below:

From the single timestamp value retrieved from tMongoDBInput_2 component, we tell Talend to transform the value as below:

out_file:

  • key=checkpoint
  • value=timestamp

out_context:

  • key=end
  • value=timestamp

tFileOutputDelimited_1

Export a key/value pair as a delimited output to a file (checkpoint.txt). This will actually import the incoming key/value pair from tMap_1 component and write to checkpoint.txt in the following format:

checkpoint;[timestamp value]

Specify the component option as below:

1. File Name: delete the default value and press Ctrl + Spacebar on keyboard. Choose "tFileList_1.CURRENT_FILEPATH". The generated value would be:

((String)globalMap.get("tFileList_1_CURRENT_FILEPATH"))

2. Field Separator: ";"

3. Click Sync Columns

tContextLoad_2

Export a key/value pair as a job context. This component exports the incoming data from tMap and sets the key/value pair of context.end to the timestamp value. We should now have two contexts used by our job:

  • context.checkpoint (set by tContextLoad_1)
  • context.end (set by tContextLoad_2)

Next, we need to define both contexts and assign a default value. Go to Contexts(Job mongo2hadoop) tab and add 'end' and 'checkpoint' with default value 0, similar to the following screenshot:

Read Data and Load to HDFS

The last subjob is to read the relevant data from the MongoDB collection (read all documents with a timestamp value between context.checkpoint and context.end) and load it to Hadoop as an HDFS output file. 

Add tMongoDBInput and tHDFSOutput into the Designer workspace. Map them together with other components as per below:

tMongoDBInput_2

Under the Component tab, check Use existing connection and choose tMongoDBConnection_1 from the drop down list, specify the collection name and click Edit schema. This will open a new window where you can define all columns/fields of your collection.


We are going to define all fields (use the '+' button to add field) from our collection. Click OK once done. Specify the find expression in the Query text field. Since we are going to read between context.checkpoint and context.end, the following expression should be sufficient:

"{timestamp: {$gte: "+context.checkpoint+", $lt: "+context.end+"}}"

tHDFSOutput_1

Click Sync columns to sync columns between the MongoDB input and the Hadoop output. You can click Edit schema button to double check the input/output data mapping, similar to the screenshot below:


Specify the HDFS credentials and options on the Component tab:

  • Distribution: HortonWorks
  • Hadoop version: Hortonworks Data Platform V2.1(Baikal)
  • NameNode URI: "hdfs://hadoop1.cluster.com:8020"
  • User name: "hdfs"
  • File Name: "/user/hdfs/from_mongodb.csv"
  • Type: Text File
  • Action: Append
  • Check Include Header

HortonWorks NameNode URI listens on port 8020. Specify the default user "hdfs" and you can test the connection to Hadoop by attempting to browse the file path (click on the '...' button next to File Name).

Test the Job

The job is expecting to append output to an existing file called /user/hdfs/from_mongodb.csv. We need to create this file in HDFS:

$ su - hdfs

$ hdfs dfs -touchz/user/hdfs/from_mongodb.csv

The design part is now complete. Let’s run the Job to test that everything is working as expected. Go to the Run (mongo2hadoop) tab and click on Run button:


Examine the debug output and verify that the data exists in the HDFS output file:

$ su - hdfs

$ hdfs dfs -cat/user/hdfs/from_mongodb.csv |wc-l2503435

The domstream collection contains 2503434 documents, while the transferred data in HDFS has 2503435 lines (with an extra line for header, so the value is correct). Try it a couple of times and make sure that only new inserted documents are appended to the HDFS output file.


Job Deployment and Scheduling

Once you are happy with the ETL process, we can export the job as a Unix Shell Script or Windows Batch File and let it run in our production environment. In this case, the exported job will be scheduled to run on the MongoDB server every 5 minutes.

Right click on the mongo2hadoop job in Repository tab and click Build Job. Choose the Shell Launcher to Unix and click Finish:


The standalone job package requires Java to be installed on the running system. Install Java and unzip on the MongoDB server using package manager:

$ yum install-y java-1.7.0-openjdk unzip# Redhat/CentOS

$ sudoapt-get install openjdk-7-jre # Debian/Ubuntu

*Note: You can use official JDK from Oracle instead of OpenJDK release, please refer to the Oracle documentation. 

Copy the package from your local workstation to the MongoDB server and extract it:

$ mkdir-p/root/scripts

$ unzip mongo2hadoop_0.1.zip -d/root/scripts

Edit the cron definition:

$ crontab -e

Configure the cron to execute the command every 5 minutes by adding following line:

0*/5***/bin/sh/root/scripts/mongo2hadoop/mongo2hadoop_run.sh

Reload cron to apply the change:

$ service crond reload # Redhat/CentOS

$ sudo service cron restart # Debian/Ubuntu

Our data integration process is now complete. We should see data in an HDFS output file which has been exported from MongoDB, new data will be appended every 5 minutes. Analysis can then be performed on this "semi-live" data that is 5 minutes old. It is possible to run the jobs during shorter intervals, e.g. every 1 minute, in case you want to perform analysis of behavioural data and use the resulting insight in the application, while the user is still logged in. 


Blog category:


How to Configure Drupal with MongoDB Replica Set

$
0
0

Drupal’s modular setup allows for different datastores to be integrated as modules, this allows sites to store different types of Drupal data into MongoDB. You can choose to store Drupal’s cache, session, watchdog, block information, queue and field storage data in either a standalone MongoDB instance or in a MongoDB Replica Set in conjunction with MySQL as the default datastore. If you’re looking at clustering your entire Drupal setup, then see this blog on how to cluster MySQL and the file system.

In this blog post, we are going to integrate our existing Drupal installation which runs on MySQL with a MongoDB Replica Set. We are running on Drupal 7, which is located under /var/www/html/drupal on server 192.168.50.200. It has been installed and configured with a MySQL server running on the same host and Drupal is running and accessible via http://192.168.50.200/drupal.

Our architecture looks like the following:

Deploying MongoDB Replica Set

1. Use the MongoDB Configurator to generate a deployment package. In the wizard, we used the following values when configuring our replica set:

Configuration         : Single Replicaset (primary + 2 secondaries)
Vendor                : Mongodb Inc
Infrastructure        : on-premise
Operating System      : RHEL6 - Redhat 6.x/Fedora/Centos 6.x/OLN 6.x
Number of mongod in each replica set : 3 mongod
OS User               : root
Use ‘smallfiles’?     : yes
Replica set name      : my_mongodb
ClusterControl server : 192.168.50.100
Mongo servers         : 192.168.50.101 192.168.50.102 192.168.50.103

2. Download the deployment script and start the deployment on the ClusterControl node:

$ wget http://severalnines.com/mongodb-configurator/tmp/0o54tsvbtan8f1s2d6qrgm8rh0/s9s-mongodb-10gen-1.0.0-rpm.tar.gz
$ tar -xzf s9s-mongodb-10gen-1.0.0-rpm.tar.gz
$ cd s9s-mongodb-10gen-1.0.0-rpm/mongodb/scripts/install/
$ bash ./deploy.sh 2>&1 | tee cc.log

3. The MongoDB deployment is automated and takes about 15 minutes. Once completed, the ClusterControl UI is accessible at https://192.168.50.100/clustercontrol. Enter the default admin email address and password on the welcome page and you should be redirected to the ClusterControl UI database clusters list, similar to screenshot below:


Configure PHP MongoDB driver

The following steps should be performed on your Drupal server.

1. The MongoDB module requires PHP MongoDB driver to be installed. Before we download and compile the driver, install the required packages:

$ yum install php-pear gcc openssl-devel -y

2. Install PHP MongoDB driver using pecl:

$ pecl install mongo
…
Build process completed successfully
Installing '/usr/lib64/php/modules/mongo.so'
install ok: channel://pecl.php.net/mongo-1.6.6
configuration option "php_ini" is not set to php.ini location
You should add "extension=mongo.so" to php.ini

** Accept the default option if prompted

3. Add the following line in our PHP configuration, usually located at /etc/php.ini:

extension=mongo.so

4. Restart Apache web server to load the change:

$ service httpd restart

5. Verify the mongo driver is loaded correctly with PHP info and pecl list:

$ php -i | grep mongo
$ pecl list
INSTALLED PACKAGES, CHANNEL PECL.PHP.NET:
=========================================
PACKAGE  VERSION STATE
APC      3.1.9   stable
memcache 3.0.5   beta
mongo    1.6.6   stable


Installing Drupal MongoDB module

1. Download the module for MongoDB 7.x-1.x-dev (under Development releases) from this page:

$ cd ~
$ wget http://ftp.drupal.org/files/projects/mongodb-7.x-1.x-dev.tar.gz
$ tar -xzf mongodb-7.x-1.x-dev.tar.gz

2. Move the module directory into Drupal at drupal/sites/all/modules and ensure the web files have proper permissions:

$ mv ~/mongodb /var/www/html/drupal/sites/all/modules
$ chown -Rf apache.apache /var/www/html/drupal/sites/all/modules/mongodb

3. Create a custom setting for MongoDB under the respective sites. In this case, we are creating it under default site:

$ vim /var/www/html/drupal/sites/default/local.settings.php

And add the following:

<?php
#MongoDB
$conf['mongodb_connections'] = array(
     'default' => array(
       'host' => '192.168.50.101,192.168.50.102,192.168.50.103',                       
       'db' => 'drupal', // Database name. Mongodb will automatically create the database.
       'connection_options' => array( 'replicaSet' => 'my_mongodb_0' ),
      ),
   );

include_once('./includes/cache.inc');

# -- Configure Cache
   $conf['cache_backends'][] = 'sites/all/modules/mongodb/mongodb_cache/mongodb_cache.inc';
   $conf['cache_class_cache'] = 'DrupalMongoDBCache';
   $conf['cache_class_cache_bootstrap'] = 'DrupalMongoDBCache';
   $conf['cache_default_class'] = 'DrupalMongoDBCache';

   # -- Don't touch SQL if in Cache
   $conf['page_cache_without_database'] = TRUE;
   $conf['page_cache_invoke_hooks'] = FALSE;

   # Session Caching
   $conf['session_inc'] = 'sites/all/modules/mongodb/mongodb_session/mongodb_session.inc';
   $conf['cache_session'] = 'DrupalMongoDBCache';

   # Field Storage
   $conf['field_storage_default'] = 'mongodb_field_storage';

   # Message Queue
   $conf['queue_default_class'] = 'MongoDBQueue';
?>

4. We need to apply the following workaround to allow the Drupal MongoDB module to write to the primary node, which in this case is 192.168.50.101.

$ sed -i 's|localhost|192.168.50.101|g' /var/www/html/drupal/sites/all/modules/mongodb/mongodb.module
$ sed -i 's|localhost|192.168.50.101|g' /var/www/html/drupal/sites/all/modules/mongodb/mongodb.drush.inc

Now, we are ready to activate the MongoDB module.


Activate the MongoDB module

1. From the Drupal administration page, go to the Modules page and disable the Dashboard and Block modules under Core:

2. Then, enable all the MongoDB related modules under MongoDB section:


Verify the deployment

On the primary node, enter mongo console and verify that the Drupal collections exist:

my_mongodb_0:PRIMARY> show dbs
my_mongodb_0:PRIMARY> show collections
my_mongodb_0:PRIMARY> db.fields_current.node.find()

You should see any database activity captured in the ClusterControl dashboard, as per the following screenshot:

When the primary goes down and another replica member takes over the primary role, manual intervention is required to perform the failover. Run the following command on the Drupal server to select a new primary:

$ sed -i 's|<old primary>|<new primary>|g' /var/www/html/drupal/sites/all/modules/mongodb/mongodb.module
$ sed -i 's|<old primary>|<new primary>|g' /var/www/html/drupal/sites/all/modules/mongodb/mongodb.drush.inc

** Replace the <old primary> with the IP address of demoted node while <new primary> with the newly promoted primary node.

That’s it! You are now running Drupal with MySQL and MongoDB replica set.

Blog category:

High Availability Log Processing with Graylog, MongoDB and ElasticSearch

$
0
0

Graylog is an open-source log management tool. Similar to Splunk and LogStash, Graylog helps centralize and aggregate all your log files for full visibility. It also provides a query language to search through log data. For large volumes of log data in a big production setup, you might want to deploy a Graylog Cluster.

Graylog Cluster consists of several components:

  • Graylog server - Log processor
  • Graylog web UI - Graylog web user interface
  • MongoDB - store configuration and the dead letter messages
  • ElasticSearch - store messages (if you lose your ElasticSearch data, the messages are gone)

In this blog post, we are going to deploy a Graylog cluster, with a MongoDB Replica Set deployed using ClusterControl. We will configure the Graylog cluster to be able to collect syslog from several devices through a load balanced syslog TCP running on HAProxy. This is to allow high availability single endpoint access with auto failover in case if any of the Graylog servers goes down.

Our Graylog cluster consists of 4 nodes:

  • web.local - ClusterControl server + Graylog web UI + HAProxy
  • graylog1.local - Graylog server + MongoDB Replica Set + ElasticSearch
  • graylog2.local - Graylog server + MongoDB Replica Set + ElasticSearch
  • graylog3.local - Graylog server + MongoDB Replica Set + ElasticSearch

The architecture diagram looks like this:

Prerequisites

All hosts are running on CentOS 7.1 64 bit with SElinux and iptables disabled. The following is the host definition inside /etc/hosts:

192.168.55.200     web.local clustercontrol.local clustercontrol web
192.168.55.201     graylog1.local graylog1
192.168.55.202     graylog2.local graylog2
192.168.55.203      graylog3.local graylog3

Ensure NTP is installed and enabled:

$ yum install ntp -y
$ systemctl enable ntpd
$ systemctl start ntpd

Deploying MongoDB Replica Set

The following steps should be performed on the ClusterControl server.

  1. Install ClusterControl on web.local:

    $ wget http://severalnines.com/downloads/cmon/install-cc
    $ chmod 755 install-cc
    $ ./install-cc
  2. Follow the installation wizard up until it finishes. Open ClusterControl UI at http://web.local/clustercontrol and create a default admin user.

  3. Setup passwordless SSH from ClusterControl server to all MongoDB nodes (including ClusterControl server itself):

    ssh-keygen -t rsa
    ssh-copy-id 192.168.55.200
    ssh-copy-id 192.168.55.201
    ssh-copy-id 192.168.55.202
    ssh-copy-id 192.168.55.203
  4. From ClusterControl UI, go to Create Database Node. We are going to deploy MongoDB Replica Set by creating one MongoDB node, then use Add Node function to expand it to a three-node Replica Set.

  5. Click on the Cluster Action icon and go to ‘Add Node to Replica Set’ and add the other two nodes, similar to screenshot below:

    Repeat the above steps for graylog3.local (192.168.55.203). Once done, at this point, you should have a three-node MongoDB Replica Set:

ClusterControl v.1.2.12 defaults to install latest version of MongoDB 3.x.

Setting Up MongoDB User

Once deployed, we need to create a database user for graylog. Login to the MongoDB console on the PRIMARY MongoDB Replica Set node (you can determine the role under the ClusterControl Overview page). In this example, it was graylog1.local:

$ mongo

And paste the following lines:

my_mongodb_0:PRIMARY> use graylog2
my_mongodb_0:PRIMARY> db.createUser(
    {
      user: "grayloguser",
      pwd: "password",
      roles: [
         { role: "readWrite", db: "graylog2" }
      ]
    }
);

Verify that the user is able to access the graylog2 schema on another replica set member (e.g. 192.168.55.202 was in SECONDARY state):

$ mongo -u grayloguser -p password 192.168.55.202/graylog2

Deploying ElasticSearch Cluster

The following steps should be performed on graylog1, graylog2 and graylog3.

  1. Graylog only supports ElasticSeach v1.7.x. Download the package from ElasticSearch website:

    $ wget https://download.elastic.co/elasticsearch/elasticsearch/elasticsearch-1.7.5.noarch.rpm
  2. Install Java OpenJDK:

    $ yum install java
  3. Install ElasticSearch package:

    $ yum localinstall elasticsearch-1.7.5.noarch.rpm
  4. Specify the following configuration file inside /etc/elasticsearch/elasticsearch.yaml:

    cluster.name: graylog-elasticsearch
    discovery.zen.ping.multicast.enabled: false
    discovery.zen.ping.unicast.hosts: ["graylog1.local", "graylog2.local", "graylog3.local"]
    discovery.zen.minimum_master_nodes: 2
    network.host: 192.168.55.203

    ** Change the value of network.host relative to the host that you are configuring.

  5. Start the ElasticSearch daemon:

    $ systemctl enable elasticsearch
    $ systemctl start elasticsearch
  6. Verify that ElasticSearch is loaded correctly:

    $ systemctl status elasticsearch -l

    And ensure it listens to the correct ports (default is 9300):

    [root@graylog3 ~]# netstat -tulpn | grep -E '9200|9300'
    tcp6       0      0 192.168.55.203:9200     :::*                    LISTEN      97541/java
    tcp6       0      0 192.168.55.203:9300     :::*                    LISTEN      97541/java

    Use curl to obtain the ElasticSearch cluster state:

    [root@graylog1 ~]# curl -XGET 'http://192.168.55.203:9200/_cluster/state?human&pretty'
    {
      "cluster_name" : "graylog-elasticsearch",
      "version" : 7,
      "master_node" : "BwQd98BnTBWADDjCvLQ1Jw",
      "blocks" : { },
      "nodes" : {
        "BwQd98BnTBWADDjCvLQ1Jw" : {
          "name" : "Misfit",
          "transport_address" : "inet[/192.168.55.203:9300]",
          "attributes" : { }
        },
        "7djnRL3iR-GJ5ARI8eIwGQ" : {
          "name" : "American Eagle",
          "transport_address" : "inet[/192.168.55.201:9300]",
          "attributes" : { }
        },
        "_WSvA3gbQK2A4v17BUWPug" : {
          "name" : "Scimitar",
          "transport_address" : "inet[/192.168.55.202:9300]",
          "attributes" : { }
        }
      },
      "metadata" : {
        "templates" : { },
        "indices" : { }
      },
      "routing_table" : {
        "indices" : { }
      },
      "routing_nodes" : {
        "unassigned" : [ ],
        "nodes" : {
          "_WSvA3gbQK2A4v17BUWPug" : [ ],
          "BwQd98BnTBWADDjCvLQ1Jw" : [ ],
          "7djnRL3iR-GJ5ARI8eIwGQ" : [ ]
        }
      },
      "allocations" : [ ]
    }

Configuring the ElasticSearch cluster is completed.

Deploying Graylog Cluster

The following steps should be performed on graylog1, graylog2 and graylog3.

  1. Download and install Graylog repository for CentOS 7:

    $ rpm -Uvh https://packages.graylog2.org/repo/packages/graylog-1.3-repository-el7_latest.rpm
  2. Install Graylog server and Java OpenJDK:

    $ yum install java graylog-server
  3. Generate a SHA sum for our Graylog admin password using the following command:

    $ echo -n password | sha256sum | awk {'print $1'}
    5e884898da28047151d0e56f8dc6292773603d0d6aabbdd62a11ef721d1542d8

    **Copy the generated value to be used as root_password_sha2 value in Graylog configuration file.

  4. Configure Graylog server configuration file at /etc/graylog/server/server.conf, and ensure following options are set accordingly:

    password_secret = password
    root_password_sha2 = 5e884898da28047151d0e56f8dc6292773603d0d6aabbdd62a11ef721d1542d8
    rest_listen_uri = http://0.0.0.0:12900/
    elasticsearch_cluster_name = graylog-elasticsearch
    elasticsearch_discovery_zen_ping_multicast_enabled = false
    elasticsearch_discovery_zen_ping_unicast_hosts = graylog1.local:9300,graylog2.local:9300,graylog3.local:9300
    mongodb_uri = mongodb://grayloguser:password@192.168.55.201:27017,192.168.55.202:27017,192.168.55.203:27019/graylog2
  5. After the configurations are saved, Graylog can be started with the following command:

    $ systemctl enable graylog-server
    $ systemctl start graylog-server

    Ensure all components are up and running inside Graylog log:

    $ tail /var/log/graylog-server/server.log
    2016-03-03T14:17:42.655+08:00 INFO  [ServerBootstrap] Services started, startup times in ms: {InputSetupService [RUNNING]=2, MetricsReporterService [RUNNING]=7, KafkaJournal [RUNNING]=7, OutputSetupService [RUNNING]=13, BufferSynchronizerService [RUNNING]=14, DashboardRegistryService [RUNNING]=21, JournalReader [RUNNING]=100, PeriodicalsService [RUNNING]=142, IndexerSetupService [RUNNING]=3322, RestApiService [RUNNING]=3835}
    2016-03-03T14:17:42.658+08:00 INFO  [ServerBootstrap] Graylog server up and running.

    **Repeat the same steps for the remaining nodes.

Deploying Graylog Web UI

The following steps should be performed on web.local.

  1. Download and install Graylog repository for CentOS 7:

    $ rpm -Uvh https://packages.graylog2.org/repo/packages/graylog-1.3-repository-el7_latest.rpm
  2. Install Graylog web UI and Java OpenJDK:

    $ yum install java graylog-web
  3. Generate a secret key. The secret key is used to secure cryptographics functions. Set this to a long and randomly generated string. You can use a simple md5sum command to generate it:

    $ date | md5sum | awk {'print $1'}
    eb6aebdeedfb2fa05742d8ca733b5a2c
  4. Configure the Graylog server URIs and application secret (taken as above) inside /etc/graylog/web/web.conf:

    graylog2-server.uris="http://192.168.55.201:12900/,http://192.168.55.202:12900/,http://192.168.55.203:12900"
    application.secret="eb6aebdeedfb2fa05742d8ca733b5a2c"

    ** If you deploy your application to several instances be sure to use the same application secret.

  5. After the configurations are saved, Graylog Web UI can be started with the following command:

    $ systemctl enable graylog-web
    $ systemctl start graylog-web

    Now, login to the Graylog Web UI at http://web.local:9000/ and with username “admin” and password “password”. You should see something like below:

Our Graylog suite is ready. Let’s configure some inputs so it can start capturing log streams and messages.

Configuring Inputs

To start capturing syslog data, we have to configure Inputs. Go to Graylog UI > System / Overview > Inputs. Since we are going to load balance the inputs via HAProxy, we need to configure the syslog input listeners to be running on TCP (HAProxy does not support UDP).

On the dropdown menu, choose “Syslog TCP” and click “Launch New Input”. In the input dialog, configure as follows:

  • Global input (started on all nodes)
  • Title: Syslog TCP 51400
  • Port: 51400

Leave the rest of the options as default and click “Launch”. We have to configure syslog port to be higher than 1024 because Graylog server is running as user “java”. You need to be root to bind sockets on ports 1024 and below on most *NIX systems. You could also try to give permission to the local user then runs graylog2-server to bind to those restricted ports, but usually just choosing a higher port is the easiest solution.

Once configured, you should notice the Global Input is running as shown in the following screenshot:

At this point, each Graylog server is now listening on TCP port 51400 for incoming syslog data. You can start configuring the devices to forward the syslog stream to the Graylog servers. The following lines show an example of rsyslog.conf configuration to start forwarding the syslog message to Graylog servers via TCP:

*.* @@192.168.55.201:51400
*.* @@192.168.55.202:51400
*.* @@192.168.55.203:51400

In the above example, rsyslog only sends to the secondary server if the first one fails. But there is also a neat way to provide a high availability single endpoint with auto failover using a load balancer. The load balancer performs the health check on Graylog servers to check if the syslog service is alive,  it will also take the dead nodes out of the load balancing set.

In the next section, we deploy HAProxy to load balance this service.

Setting up a Load Balanced Syslog Service

The following steps should be performed on web.local.

  1. Install HAProxy via package manager:

    $ yum install -y haproxy
  2. Clear the existing HAProxy configuration:

    $ cat /dev/null > /etc/haproxy/haproxy.cfg

    And add following lines into /etc/haproxy/haproxy.cfg:

    global
        log         127.0.0.1 local2
        chroot      /var/lib/haproxy
        pidfile     /var/run/haproxy.pid
        maxconn     4000
        user        haproxy
        group       haproxy
        daemon
        stats socket /var/lib/haproxy/stats
    
    defaults
        mode                    http
        log                     global
        option                  dontlognull
        option                  redispatch
        retries                 3
        timeout http-request    10s
        timeout queue           1m
        timeout connect         10s
        timeout client          1m
        timeout server          1m
        timeout http-keep-alive 10s
        timeout check           10s
        maxconn                 3000
    
    userlist STATSUSERS
             group admin users admin
             user admin insecure-password password
             user stats insecure-password PASSWORD
    
    listen admin_page 0.0.0.0:9600
           mode http
           stats enable
           stats refresh 60s
           stats uri /
           acl AuthOkay_ReadOnly http_auth(STATSUSERS)
           acl AuthOkay_Admin http_auth_group(STATSUSERS) admin
           stats http-request auth realm admin_page unless AuthOkay_ReadOnly
           #stats admin if AuthOkay_Admin
    
    listen syslog_tcp_514
           bind *:514
           mode tcp
           timeout client  120s
           timeout server  120s
           default-server inter 2s downinter 5s rise 3 fall 2 maxconn 64 maxqueue 128 weight 100
           server graylog1 192.168.55.201:51400 check
           server graylog2 192.168.55.202:51400 check
           server graylog3 192.168.55.203:51400 check
  3. Enable HAProxy daemon on boot and start it up:

    $ systemctl enable haproxy
    $ systemctl start haproxy
  4. Verify that HAProxy listener turns green, indicating the backend services are healthy:

Our syslog service is now load balanced between three Graylog servers on TCP port 514. Next we configure our devices to start sending out syslog messages over TCP to the HAProxy instance.

Configuring Syslog TCP Clients

In this example, we are going to use rsyslog on a standard Linux box to forward syslog messages to the load balanced syslog servers.

  1. Install rsyslog on the client box:

    $ yum install rsyslog # RHEL/CentOS
    $ apt-get install rsyslog # Debian/Ubuntu
  2. Then append the following line into /etc/rsyslog.conf under “catch-all” log files section (line 94):

    *.* @@192.168.55.200:514

    **Take note that ‘@@’ means we are forwarding syslog messages through TCP, while single ‘@’ is for UDP.

  3. Restart syslog to load the new configuration:

    $ systemctl restart syslog
  4. Now we can see the log message stream pouring in under Global inputs section. You can verify this from the “Network IO” section as highlighted by the red arrows in the screenshot below:

    Verify the incoming log messages by clicking on ‘Show received messages’:

We now have a highly available log processing cluster with Graylog, MongoDB Replica Set, HAProxy and ElasticSearch cluster.

Notes

  • This setup does not cover high availability for Graylog web UI, HAProxy and ClusterControl. In order to achieve full resilient setup, we have to have another node to serve as the secondary HAProxy and Graylog web UI with virtual IP address using Keepalived.
  • For ClusterControl redundancy, you have to setup a standby ClusterControl server to get higher availability.

Watch the replay: Become a MongoDB DBA (if you’re really a MySQL user)

$
0
0

Thanks to everyone who participated in this week’s webinar on ‘Become a MongoDB DBA’! Our colleague Art van Scheppingen presented from the perspective of a MySQL DBA who might be called to manage a MongoDB database, which included a live demo on how to carry out the relevant DBA tasks using ClusterControl.

The replay and the slides are now available online in case you missed Tuesday’s live session or simply would like to see it again in your own time.

Watch the replayRead the slides

This was the first session of our new webinar series: ‘How to Become a MongoDB DBA’ to answer the question: ‘what does a MongoDB DBA do’?

In this initial webinar, we went beyond the deployment phase and demonstrated how you can automate tasks, monitor a cluster and manage MongoDB; whilst also automating and managing your MySQL and/or PostgreSQL installations. Watch out for invitations for the next session in this series!

This Session's Agenda

  • Introduction to becoming a MongoDB DBA
  • Installing & configuring MongoDB
  • What to monitor and how
  • How to perform backups
  • Live Demo

Speaker

Art van Scheppingen is a Senior Support Engineer at Severalnines. He’s a pragmatic MySQL and Database expert with over 15 years experience in web development. He previously worked at Spil Games as Head of Database Engineering, where he kept a broad vision upon the whole database environment: from MySQL to Couchbase, Vertica to Hadoop and from Sphinx Search to SOLR. He regularly presents his work and projects at various conferences (Percona Live, FOSDEM) and related meetups.

This series is based upon the experience we have using MongoDB and implementing it for our database infrastructure management solution, ClusterControl. For more details, read through our ‘Become a ClusterControl DBA’ blog series.

Webinar: Become a MongoDB DBA - What to Monitor (if you’re really a MySQLer)

$
0
0

To operate MongoDB efficiently, you need to have insight into database performance. And with that in mind, we’ll dive into monitoring in this second webinar in the ‘Become a MongoDB DBA’ series.

MongoDB offers many metrics through various status overviews and commands, but which ones really matter to you? How do you trend and alert on them? What is the meaning behind the metrics?

We’ll discuss the most important ones and describe them in ordinary plain MySQL DBA language. And we’ll have a look at the open source tools available for MongoDB monitoring and trending.

Finally, we’ll show you how to leverage ClusterControl’s MongoDB metrics, dashboards, custom alerting and other features to track and optimize the performance of your system.

Date, Time & Registration

Europe/MEA/APAC

Tuesday, July 12th at 09:00 BST / 10:00 CEST (Germany, France, Sweden)
Register Now

North America/LatAm

Tuesday, July 12th at 09:00 Pacific Time (US) / 12:00 Eastern Time (US)
Register Now

Agenda

  • How does MongoDB monitoring compare to MySQL
  • Key MongoDB metrics to know about
  • Trending or alerting?
  • Available open source MongoDB monitoring tools
  • How to monitor MongoDB using ClusterControl
  • Demo

Speaker

Art van Scheppingen is a Senior Support Engineer at Severalnines. He’s a pragmatic MySQL and Database expert with over 16 years experience in web development. He previously worked at Spil Games as Head of Database Engineering, where he kept a broad vision upon the whole database environment: from MySQL to Couchbase, Vertica to Hadoop and from Sphinx Search to SOLR. He regularly presents his work and projects at various conferences (Percona Live, FOSDEM) and related meetups.

We look forward to “seeing” you there!

This session is based upon the experience we have using MongoDB and implementing it for our database infrastructure management solution, ClusterControl. For more details, read through our ‘Become a MongoDB DBA’ blog series.

Become a MongoDB DBA: Monitoring and Trending (part 1)

$
0
0

After covering the deployment and configuration of MongoDB in our previous blogposts, we now move on to monitoring basics. Just like MySQL, MongoDB has a broad variety of metrics you can collect and use to monitor the health of your systems. In this blog post we will cover some of the most basic metrics. This will set the scene for the next blog posts where we will dive deeper into their meanings and into storage engine specifics.

Monitoring or Trending?

To manage your databases, you as the DB admin would need good visibility into what is going on. Remember that if a database is not available or not performing, you will be the one under pressure so you want to know what is going on. If there is no monitoring and trending system available, this should be the highest priority. Why? Let’s start by defining ‘trending’ and ‘monitoring’.

A monitoring system is a system that keeps an eye on the database servers and alerts you if something is not right, e.g., a database is offline or the number of connections crossed some defined threshold. In such case, the monitoring system will send a notification in some pre-defined way. Such systems are crucial because, obviously, you want to be the first to know if something’s not right with the database.

On the other hand, a trending system is your window into the database internals and how they change over time. It will provide you with graphs that show you how those cogwheels are working in the system - the number of connections per second, how many read/write operations the database does on different levels, how many seconds of replication lag do we have, how large was the last journal group commit, and so on.

Data is presented as graphs for better visibility - from graphs, the human mind can easily derive trends and locate anomalies. The trending system also gives you an idea of how things change over time - you need this visibility in both real time and for historical data, as things happen also when people sleep. If you have been on-call in an ops team, it is not unusual for an issue to have disappeared by the time you get paged at 3am, wake up, and log into the system.

Whether you are monitoring or trending, in both cases you will need some sort of input to base your decisions upon. In both cases you will need to collect metrics and analyze them.

Host metrics

Host metrics are equally important to MongoDB as they are for MySQL. MongoDB is a database system, so it will behave in a large degree the same as MySQL. High load, low IO and low CPU utilization? Your MySQL instinct will be right here as well: there must be some sort of locking issue.

So in terms of host metrics, capture everything you would normally do for any other database:

  • CPU usage / load / cpusteal
  • Memory usage
  • IO
  • Network

dbStats

The most basic check you wish to perform on any MongoDB host is whether the service is running and responding. Alongside that check, you can fetch the database statistics to give you the most basic metrics

my_mongodb_0:PRIMARY> use admin
switched to db admin
my_mongodb_0:PRIMARY> db.runCommand( { dbStats : 1 } )
{
    "db" : "admin",
    "collections" : 2,
    "objects" : 2,
    "avgObjSize" : 198,
    "dataSize" : 396,
    "storageSize" : 32768,
    "numExtents" : 0,
    "indexes" : 3,
    "indexSize" : 49152,
    "ok" : 1
}

It is important to switch to the admin database, as otherwise you will capture the stats from the database that you are using. We can spot already here a couple of important stats: the number of collections (like tables), objects, data/storage size and index size. This is a good metric to keep an eye on the growth rate of your MongoDB cluster.

serverStatus

The server status is comparable to the MySQL show global status command: it will contain the most important stats from MongoDB. Depending on the storage engine that you are using, this will contain the stats for WiredTiger, MongoRocks or TokuMX.

An example of the output from the serverStatus would be:

my_mongodb_0:SECONDARY> db.serverStatus()
{
    "host" : "mongo2.mydomain.com",
    "advisoryHostFQDNs" : [ ],
    "version" : "3.2.7",
    "process" : "mongod",
    "pid" : NumberLong(26939),
    "uptime" : 90345,
    "uptimeMillis" : NumberLong(90345007),
    "uptimeEstimate" : 87717,
    "localTime" : ISODate("2016-06-15T15:53:52.235Z"),
    "connections" : {
        "current" : 5,
        "available" : 51195,
        "totalCreated" : NumberLong(36205)
    },
    "globalLock" : {
        "totalTime" : NumberLong("90345004000"),
        "currentQueue" : {
            "total" : 0,
            "readers" : 0,
            "writers" : 0
        },
        "activeClients" : {
            "total" : 34,
            "readers" : 0,
            "writers" : 0
        }
    },
    "storageEngine" : {
        "name" : "wiredTiger",
        "supportsCommittedReads" : true,
        "persistent" : true
    },
    "wiredTiger" : {
        "uri" : "statistics:",
… 
    },
    "ok" : 1
}

As you can see the flexibility of JSON comes in handy here. Unlike MySQL you are not bound by a predefined set of status variables. The wiredTiger object is present here, while when using MongoRocks, we would have an additional rocksdb object. You can find the storage engine in use under the storageEngine object.

That brings us to the subject of querying a specific object within the server status. As MongoDB is all about JSON you can query for one of these objects directly to only receive this object in the result output. Unfortunately this selection only is exclusive, so you need to filter out the ones you don’t want. For example, if we wish to only see the replicaSet information we have to filter out the remainder:

my_mongodb_0:PRIMARY> db.serverStatus({ wiredTiger: 0, asserts: 0, metrics:  0, tcmalloc: 0, locks: 0, opcountersRepl: 0, opcounters: 0, network: 0, globalLock: 0, extra_info: 0, connections: 0, storageEngine: 0})
{
    "host" : "n2",
    "advisoryHostFQDNs" : [ ],
    "version" : "3.2.6-1.0",
    "process" : "mongod",
    "pid" : NumberLong(12122),
    "uptime" : 600,
    "uptimeMillis" : NumberLong(599289),
    "uptimeEstimate" : 576,
    "localTime" : ISODate("2016-06-18T11:13:09.080Z"),
    "repl" : {
        "hosts" : [
            "10.10.32.11:27017",
            "10.10.32.12:27017",
            "10.10.32.13:27017"
        ],
        "setName" : "my_mongodb_0",
        "setVersion" : 1,
        "ismaster" : true,
        "secondary" : false,
        "primary" : "10.10.32.11:27017",
        "me" : "10.10.32.11:27017",
        "electionId" : ObjectId("7fffffff0000000000000001"),
        "rbid" : 1522923277
    },
    "storageEngine" : {
        "name" : "wiredTiger",
        "supportsCommittedReads" : true,
        "persistent" : true
    },
    "ok" : 1
}

Please note that the object in the serverStatus does not contain all information available for replication. So we will have a look at that now.

getReplicationInfo

MongoDB supports Javascript functions to run within the database. This is comparable with the stored procedures in RDBMS-es and gives the DBA a lot of flexibility. The command getReplicationInfo is actually a wrapper function that compiles its output from various sources.

The wrapper function will retrieve information from the oplog to calculate its size and usage. Also it will calculate the time difference between the first entry and last entry in the oplog. On high transaction replicaSets, this will give very useful information: the replication window in your oplog. Suppose one of your replicas goes offline, this will tell you approximately how long it can stay offline without the need of a sync. In MySQL Galera terms: the time before an SST is triggered.

If you are interested in the code, you can have a look at it by calling the function without the brackets:

my_mongodb_0:PRIMARY> db.getReplicationInfo

replSetGetStatus

More detailed information about the replicaSet can be retrieved by running the replSetGetStatus command.

my_mongodb_0:PRIMARY> db.runCommand( { replSetGetStatus: 1 } )
{
    "set" : "my_mongodb_0",
    "date" : ISODate("2016-06-18T11:40:34.491Z"),
    "myState" : 1,
    "term" : NumberLong(1),
    "heartbeatIntervalMillis" : NumberLong(2000),
    "members" : [
        {
            "_id" : 0,
            "name" : "10.10.32.11:27017",
            "health" : 1,
            "state" : 1,
            "stateStr" : "PRIMARY",
            "uptime" : 2245,
            "optime" : {
                "ts" : Timestamp(1466247801, 5),
                "t" : NumberLong(1)
            },
            "optimeDate" : ISODate("2016-06-18T11:03:21Z"),
            "electionTime" : Timestamp(1466247800, 1),
            "electionDate" : ISODate("2016-06-18T11:03:20Z"),
            "configVersion" : 1,
            "self" : true
        },
        {
            "_id" : 1,
            "name" : "10.10.32.12:27017",
            "health" : 1,
            "state" : 2,
            "stateStr" : "SECONDARY",
            "uptime" : 2244,
            "optime" : {
                "ts" : Timestamp(1466247801, 5),
                "t" : NumberLong(1)
            },
            "optimeDate" : ISODate("2016-06-18T11:03:21Z"),
            "lastHeartbeat" : ISODate("2016-06-18T11:40:32.992Z"),
            "lastHeartbeatRecv" : ISODate("2016-06-18T11:40:34.382Z"),
            "pingMs" : NumberLong(0),
            "syncingTo" : "10.10.32.11:27017",
            "configVersion" : 1
        },
        {
            "_id" : 2,
            "name" : "10.10.32.13:27017",
            "health" : 1,
            "state" : 2,
            "stateStr" : "SECONDARY",
            "uptime" : 2244,
            "optime" : {
                "ts" : Timestamp(1466247801, 5),
                "t" : NumberLong(1)
            },
            "optimeDate" : ISODate("2016-06-18T11:03:21Z"),
            "lastHeartbeat" : ISODate("2016-06-18T11:40:32.990Z"),
            "lastHeartbeatRecv" : ISODate("2016-06-18T11:40:34.207Z"),
            "pingMs" : NumberLong(0),
            "syncingTo" : "10.10.32.11:27017",
            "configVersion" : 1
        }
    ],
    "ok" : 1
}

This will contain the detailed information per node in the replicaSet, including the health, state, optime and the timestamp of the last heartbeat received. Optime will be a document containing the timestamp of the last entry executed from the oplog. With this you can easily calculate the replication lag per node: subtract this value from the timestamp of the primary and you will have the lag in seconds.

Heartbeats are sent via TCP multicast between each member every two seconds. Heartbeats are used to both determine if other nodes are available/responsive, and take a big part in the new primary election if the primary happens to fail.

Shipping metrics

Now you know which functions to use to extract certain metrics, but what about storing them in your own monitoring or trending system? For ClusterControl, we have our own internal collector that allows us to run our own queries against MongoDB, but not all systems allow you to define your own queries. In some cases you don’t need to as they feature all statistics out of the box.

For your convenience here is a short overview of some of them.

Statsd

https://github.com/torkelo/mongodb-metrics

This is the most complete MongoDB collector for StatsD. It fetches the most important metrics from MongoDB and ships them to StatsD (and Graphite). Unfortunately it can’t run custom queries or fetch other metrics than the pre-defined ones.

There are a few other projects on Github that ship metrics from MongoDB to StatsD, but these are mostly meant to send data from the collections to StatsD.

OpenTSDB (built in)

https://github.com/OpenTSDB/tcollector

OpenTSDB has a couple of default collectors built in, including a MongoDB collector that imports all available metrics.

Prometheus.io

https://github.com/dcu/mongodb_exporter

A very complete MongoDB exporter for Prometheus. This exporter contains all the major metrics, good description on the metrics and it even does a little bit of interpretation. At the moment of writing, the exporter did not yet support WiredTiger.

Cacti

https://www.percona.com/doc/percona-monitoring-plugins/1.1/cacti/mongodb-templates.html

The Percona Monitoring Plugins for MySQL already was an extensive collection of metrics and dashboards, and their Cacti plugins for MongoDB are equally complete for MongoDB. At this moment they don’t yet support WiredTiger specific metrics.

Monitoring and Trending MongoDB in ClusterControl

In the recent releases of ClusterControl we have been improving MongoDB monitoring and trending. We are now collecting the most important metrics for replication, journalling and WiredTiger. We can use these metrics to monitor and trend MongoDB, like any other database, in ClusterControl.

Collecting these metrics also allows us to go beyond monitoring and reuse these metrics in our advisors, and give advice to improve certain aspects of the database system. Using the Developer Studio, we allow you to even write your own checks, logic and automation.

Conclusion

We have covered how to collect the metrics, what tools you can use to collect them. However we clearly have not covered the true meaning behind these metrics, or how to combine them with other metrics to gain more insights. That’s what we will do in our next blog post.

Sign up for our webinar on monitoring MongoDB (if you’re really a MySQL DBA)

$
0
0

In this new webinar on July 12th, we’ll discuss the most important metrics MongoDB offers and will describe them in ordinary plain MySQL DBA language. We’ll have a look at the open source tools available for MongoDB monitoring and trending. And finally, we’ll show you how to leverage ClusterControl’s MongoDB metrics, dashboards, custom alerting and other features to track and optimize the performance of your system.

To operate MongoDB efficiently, you need to have insight into database performance. And with that in mind, we’ll dive into monitoring in this second webinar in the ‘Become a MongoDB DBA’ series.

Date, Time & Registration

Europe/MEA/APAC

Tuesday, July 12th at 09:00 BST / 10:00 CEST (Germany, France, Sweden)
Register Now

North America/LatAm

Tuesday, July 12th at 09:00 Pacific Time (US) / 12:00 Eastern Time (US)
Register Now

Agenda

  • How does MongoDB monitoring compare to MySQL
  • Key MongoDB metrics to know about
  • Trending or alerting?
  • Available open source MongoDB monitoring tools
  • How to monitor MongoDB using ClusterControl
  • Demo

Speaker

Art van Scheppingen is a Senior Support Engineer at Severalnines. He’s a pragmatic MySQL and Database expert with over 16 years experience in web development. He previously worked at Spil Games as Head of Database Engineering, where he kept a broad vision upon the whole database environment: from MySQL to Couchbase, Vertica to Hadoop and from Sphinx Search to SOLR. He regularly presents his work and projects at various conferences (Percona Live, FOSDEM) and related meetups.

We look forward to “seeing” you there!


This session is based upon the experience we have using MongoDB and implementing it for our database infrastructure management solution, ClusterControl. For more details, read through our ‘Become a MongoDB DBA’ blog series.

Become a MongoDB DBA: Monitoring and Trending (part 2)

$
0
0

In the previous post, we introduced the various functions and commands in MongoDB to retrieve your metrics. We also showcased a few out-of-the-box solutions (statsd, OpenTSDB, Prometheus, Cacti) that ship MongoDB metrics directly to some of the popular monitoring and trending tools. Today we will dive a bit deeper into the metrics: group them together and see which ones are the most important ones to keep an eye on.
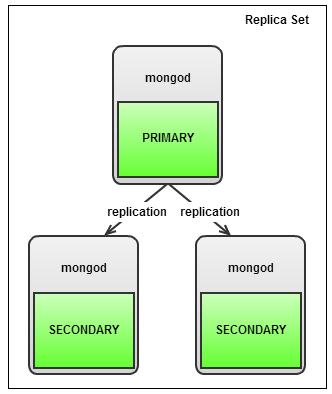
Replication

Oplog

With MongoDB replication, the most important aspect is the oplog. As we described in an earlier blog post about MongoDB configuration, the oplog is comparable to the MySQL binary log. It keeps a history of all transactions in this log file, but in contrary to the MySQL binary log, MongoDB only has one single collection where it stores them. This collection is limited in size. This means that once it is full, old transactions will get purged once a new transaction come in. It will evict the oldest transaction first, so the method used here is FIFO (First In, First Out). Therefore the most important metric to watch is the replication window: the duration of transactions kept in the oplog.

Why is this important? Suppose one of the secondary nodes loses network connectivity with the primary, it will no longer replicate data from the primary. Once it comes back online this secondary node has to catch up with already replicated transactions. It will use the oplog for this purpose. If the secondary node went offline for too long, it can’t use the oplog anymore and a full sync is necessary. A full sync, just like the SST in Galera, is an expensive operation and you would want to avoid this.

mongo_replica_0:PRIMARY> db.getReplicationInfo()
{
    "logSizeMB" : 1895.7751951217651,
    "usedMB" : 0.01,
    "timeDiff" : 11,
    "timeDiffHours" : 0,
    "tFirst" : "Fri Jul 08 2016 10:56:01 GMT+0000 (UTC)",
    "tLast" : "Fri Jul 08 2016 10:56:12 GMT+0000 (UTC)",
    "now" : "Fri Jul 08 2016 12:38:36 GMT+0000 (UTC)"
}

As you can see the time difference is already present in the output from the getReplicationInfo function. You can choose to use either the timeDiff in seconds or timeDiffHours in hours here. A side note: this function is only available from the mongo command line tool, so if you want to get this via connecting directly to MongoDB, you will have to get the first and last record from the oplog and calculate the time difference.

If you see the oplog window is becoming (too) short, you can act on this and increase the oplog size for the cluster. Increasing the size of the oplog is a lengthy and painful process where you have to apply the change on every node, one node at a time. See also the MongoDB documentation on this subject.
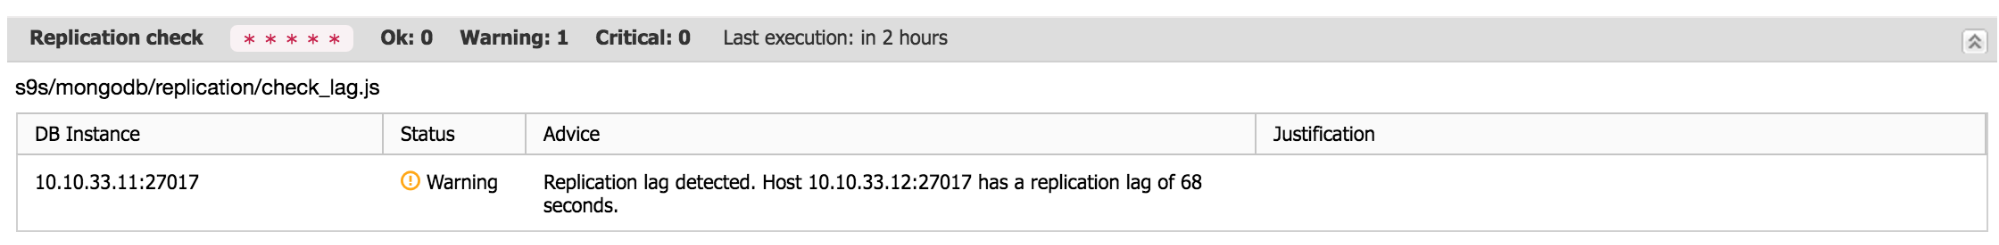
Replication Lag

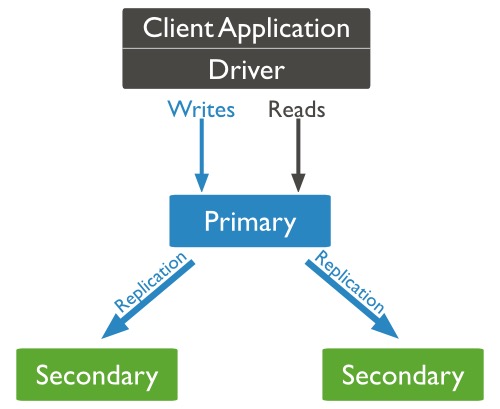
Replication lag is very important to keep an eye on: performing read operations on the primary MongoDB node will proxy your request to secondary nodes. MongoDB will only use these secondaries if they don’t lag too far behind. You could bypass this by connecting directly to a secondary node. However, you then need to keep an eye on the lag yourself. If the secondary has replication lag, you risk serving out stale data that already has been overwritten on the primary.

To check the replication lag, it suffices to connect to the primary and retrieve this data from the replSetGetStatus command. In contrary to MySQL, the primary keeps track of the replication status of its secondaries.

A condensed version is seen below:

my_mongodb_0:PRIMARY> db.runCommand( { replSetGetStatus: 1 } )
{
… 
    "members" : [
        {
            "_id" : 0,
            "name" : "10.10.32.11:27017",
            "stateStr" : "PRIMARY",
            "optime" : {
                "ts" : Timestamp(1466247801, 5),
                "t" : NumberLong(1)
            },
            "optimeDate" : ISODate("2016-06-18T11:03:21Z"),
        },
        {
            "_id" : 1,
            "name" : "10.10.32.12:27017",
            "stateStr" : "SECONDARY",
            "optime" : {
                "ts" : Timestamp(1466247801, 5),
                "t" : NumberLong(1)
            },
            "optimeDate" : ISODate("2016-06-18T11:03:21Z"),
        },
        {
            "_id" : 2,
            "name" : "10.10.32.13:27017",
            "stateStr" : "SECONDARY",
            "optime" : {
                "ts" : Timestamp(1466247801, 5),
                "t" : NumberLong(1)
            },
            "optimeDate" : ISODate("2016-06-18T11:03:21Z"),
        }
    ],
    "ok" : 1
}

You can calculate the lag by simply subtracting the secondary optimeDate (or optime timestamp) from the primary optimeDate. This will give you the replication lag in seconds.

Reasons for replication lag in MongoDB can be either the hardware not able to cope with applying the transactions (CPU/Memory/IO), internal lock contention (storage engine specific) or a deliberately delayed secondary.

Operational metrics

Connection limits

Just like in MySQL, in MongoDB there are also connection and file handler limits. On the server side, MongoDB uses a similar principle to MySQL to handle connections and also supports persistent connections. It also has similar issues like MySQL, once you exhaust the maximum number of connections. The same ulimit problem exists once you exceed your OS limits, and also the same solution applies by raising the hard limits.

On the client side, it is a different story though: most drivers will enable connection pooling by default. This means that not only they will reuse the connections when necessary, but also can use them in parallel if necessary. Still if something is going wrong with your application, this means the client will spawn extra connections to satisfy the need of spare connections in the pool.

In other words: you definitely want to keep an eye on the connections going to your database.

This metric can be found in the serverStatus function:

mongo_replica_0:PRIMARY> db.serverStatus().connections
{ "current" : 25, "available" : 794, "totalCreated" : NumberLong(122418) }

This gives you an accurate number of connections at this very moment and how many are still available. If the number of connections used are going up rapidly, then you know it is time to investigate.

Transactions

In contrary to MySQL, a transaction is a broad term in MongoDB. MongoDB supports atomicity at the document level and this includes the embedded documents inside this document. Writing to a sequence of documents at once will not be atomic as other operations may be written interleaved.

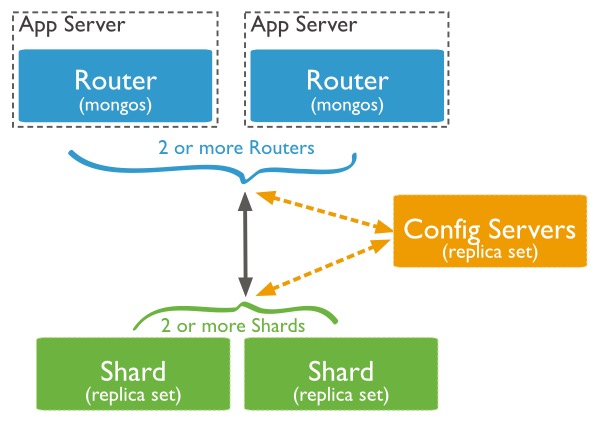
However for performing atomicity on multiple documents, you can provide the $isolated operator. This will cause the other clients requesting data not to see the changes you have made until the write operator has finished. This is not the same as a transaction though: once your write operation has reached an error there will be no rollback. Also the $isolated operator will not work on sharded clusters as it would then have to work across shards.

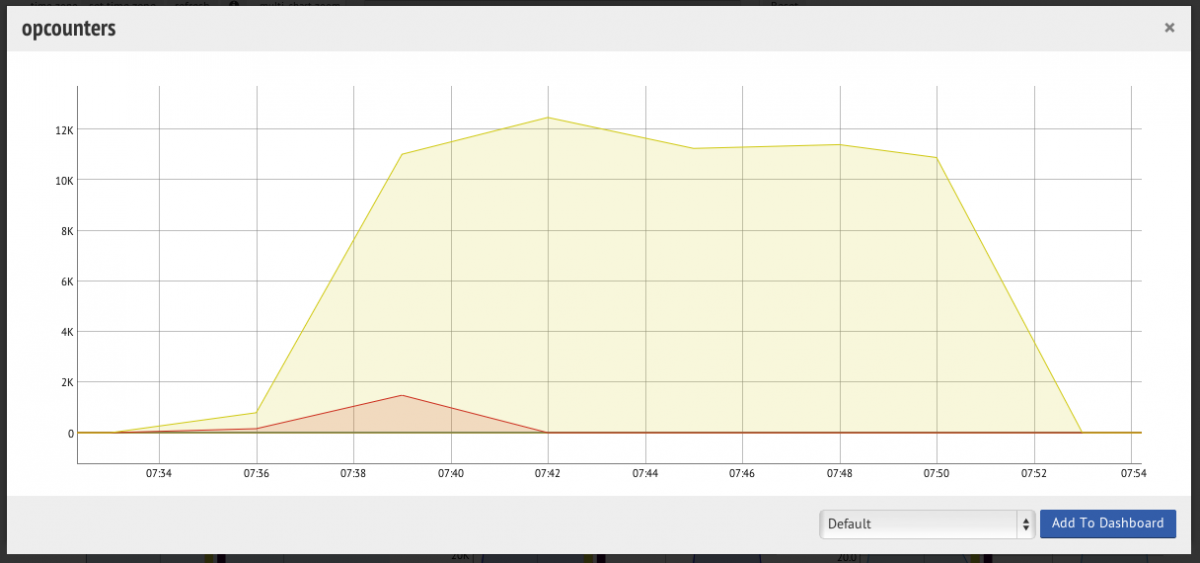
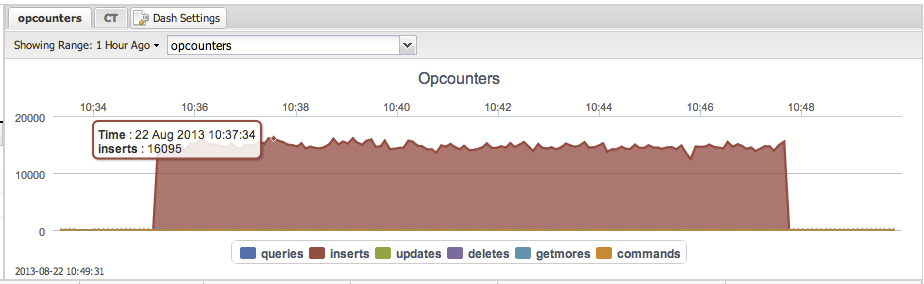
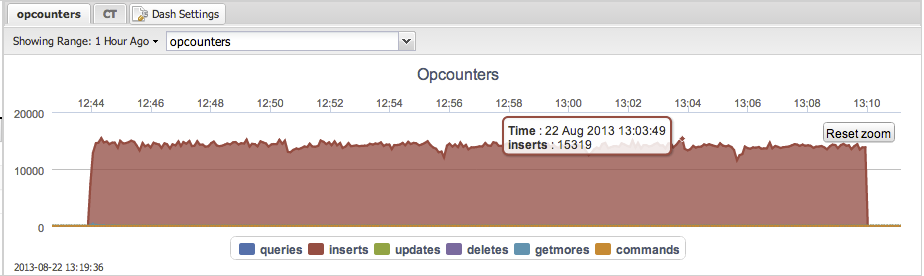
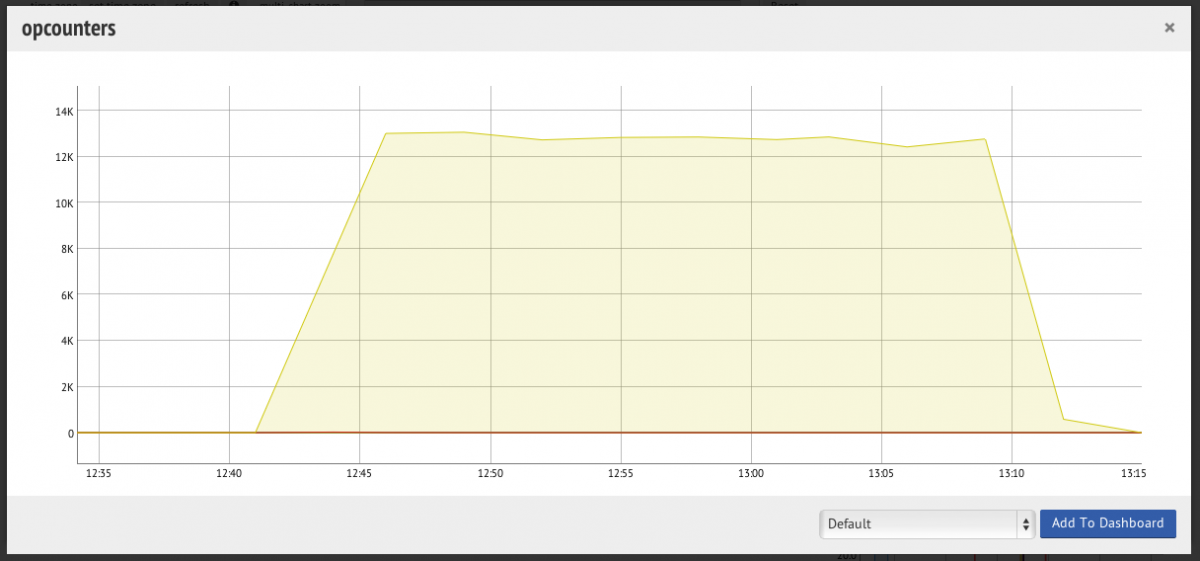
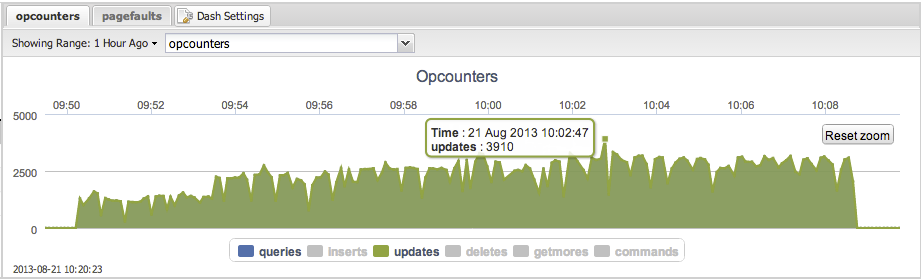
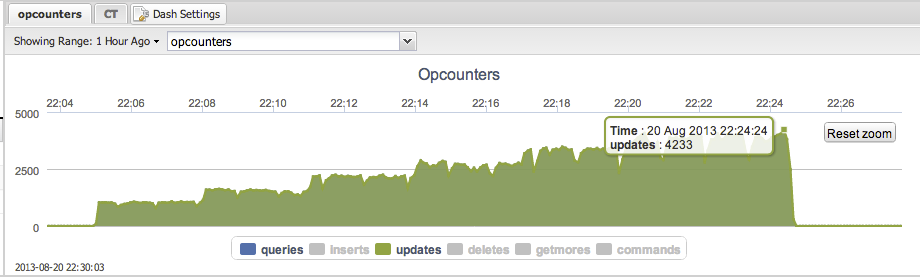
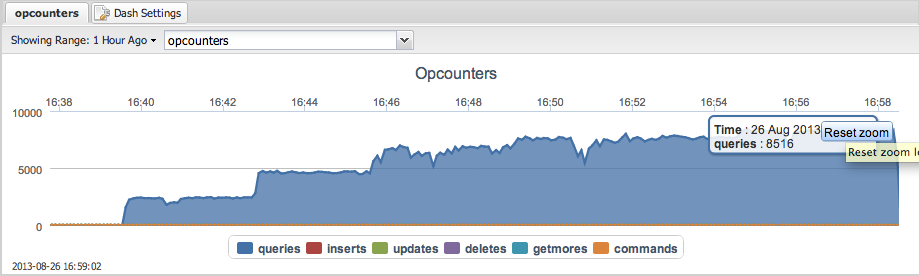
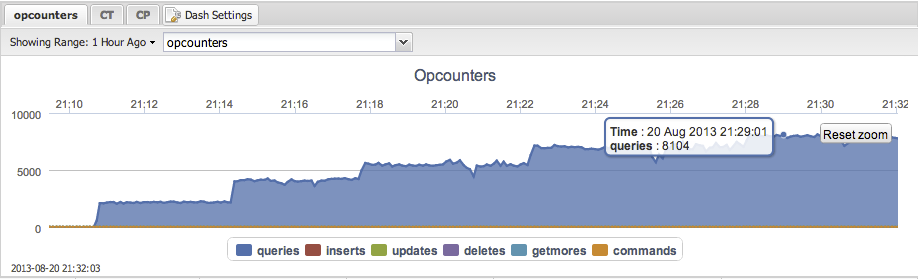
However there simply isn’t just a single metric that gives you the number of transactions in the cluster. You will have to add the opcounters together to get this number. The opcounters.command reflects the total number of read operations, so add this together with opcounters.insert,opcounters.update and opcounters.delete.

Journaling

You would easily confuse the total number of transactions with the dur.commits metric. Even though this metric’s name contains the word commit, this actually has nothing to do with the transactions.

Like with InnoDB in MySQL, MongoDB checkpoints modified data every 60 seconds. That leaves a potential gap of a maximum of 60 seconds to lose data when MongoDB receives an unclean shutdown. To resolve this, journaling has been enabled by default and this allows MongoDB to recover the transactions that are missing since the last checkpoint. The transactions will be written to the journal every interval configured in storage.journal.commitIntervalMs (100ms for WiredTiger).

For MMAP the dur.commits reflects the number of transactions written to the journal since last group commit.

mongo_replica_0:PRIMARY> db.serverStatus().dur.commits

This metric will give you a lot of insight in the workload your server will handle. You can tune the commitIntervalMs parameter to a lower value to increase the frequency of group commits. Keep in mind that this also may increase I/O dramatically.
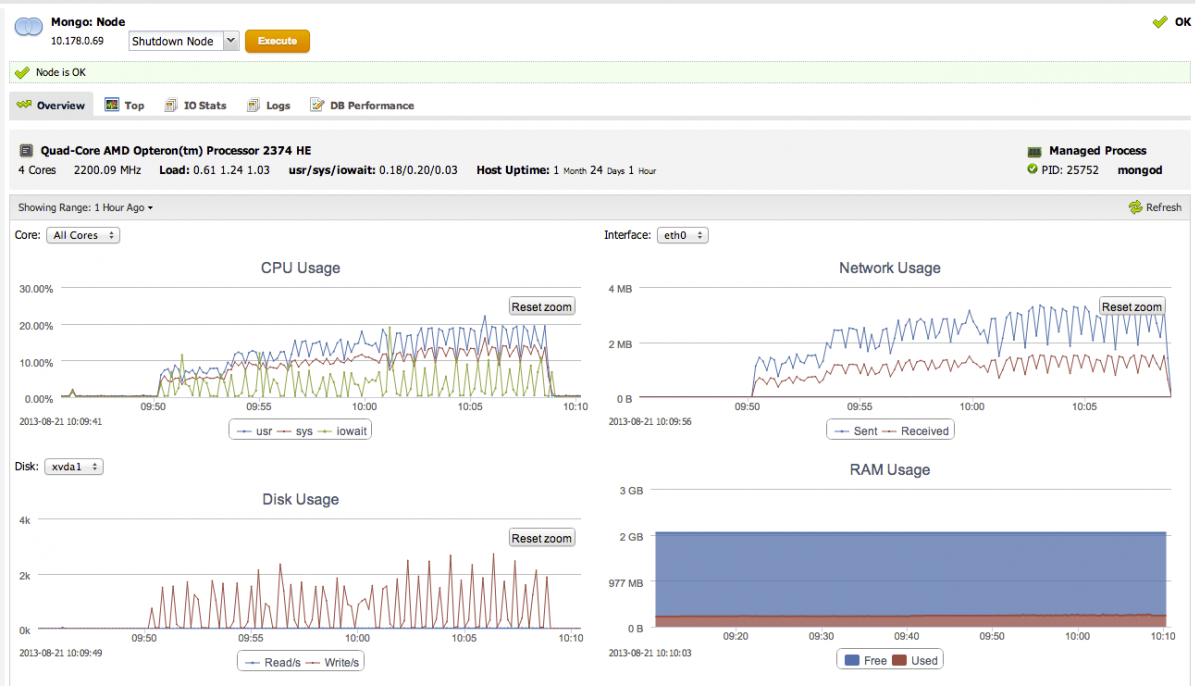
Memory usage

MongoDB uses memory for sorting, fetching, caching and also modifying data. Unlike MySQL, you actually have little influence on how much memory is used for what. The only influence you have is actually the memory used for the various storage engines.

Similar to the InnoDB bufferpool, the vast amount of memory will be consumed by either the MongoDB active memory or the WiredTiger cache. Both will work more efficiently the more memory you (can) give it.

To see how much memory MongoDB actually is using, you can fetch the mem metrics from the serverStatus:

mongo_replica_0:PRIMARY> db.serverStatus().mem
{
    "bits" : 64,
    "resident" : 401,
    "virtual" : 2057,
    "supported" : true,
    "mapped" : 0,
    "mappedWithJournal" : 0
}

To know how efficient your caching is can be interpreted by the number of page faults happening:

mongo_replica_0:PRIMARY> db.serverStatus().extra_info.page_faults
37912924

Every time MongoDB has a cache miss, and it has to retrieve data from disk it will count this as a page fault. A relatively high number of page faults, compared to the number of read operations, indicates the cache is too small. The metrics for cache statistics of WiredTiger are described below.

Detecting locks

MongoDB does support Global, Database and Collection level locking and will also report this in the serverStatus output:

mongo_replica_0:PRIMARY> db.serverStatus().locks
{
    "Global" : {
        "acquireCount" : {
            "r" : NumberLong(2667294),
            "w" : NumberLong(20),
            "R" : NumberLong(1),
            "W" : NumberLong(7)
        },
        "acquireWaitCount" : {
            "r" : NumberLong(1),
            "w" : NumberLong(1),
            "W" : NumberLong(1)
        },
        "timeAcquiringMicros" : {
            "r" : NumberLong(2101),
            "w" : NumberLong(4443),
            "W" : NumberLong(52)
        }
    },
    "Database" : {
        "acquireCount" : {
            "r" : NumberLong(1333616),
            "w" : NumberLong(8),
            "R" : NumberLong(17),
            "W" : NumberLong(12)
        }
    },
    "Collection" : {
        "acquireCount" : {
            "r" : NumberLong(678231),
            "w" : NumberLong(1)
        }
    },
    "Metadata" : {
        "acquireCount" : {
            "w" : NumberLong(7)
        }
    },
    "oplog" : {
        "acquireCount" : {
            "r" : NumberLong(678288),
            "w" : NumberLong(8)
        }
    }
}

In principle in MongoDB you should not see much locking happening as these locks are comparable global, schema and table type of locks. The document level locking is missing here as these locks are handled by the storage engine used. In the case of MMAPv1 ( < MongoDB v3.0) the locks will happen on database level.

You should collect each and every one of these metrics as they might help you find performance issues outside the storage engines.

WiredTiger

Locks and concurrency

As described in the previous section, the document level locking is handled by the storage engine. In the case of WiredTiger, it has locks to prevent one thread from writing to the same document as another thread. When a write occurs, a ticket is created to perform the write operation, where the ticket is comparable to a thread.

The number of concurrent transactions are reflected in the wiredTiger.concurrentTransactions metric:

mongo_replica_0:PRIMARY> db.serverStatus().wiredTiger.concurrentTransactions
{
    "write" : {
        "out" : 0,
        "available" : 128,
        "totalTickets" : 128
    },
    "read" : {
        "out" : 0,
        "available" : 128,
        "totalTickets" : 128
    }
}

This metric is important because of two reasons: if you see a sudden increase in the write.out tickets, there is probably a lot of document locking going on. Also if the read.available or write.available metrics are nearing zero your threads are getting exhausted. The result will be that new incoming requests are going to be queued.

Transactions

In contrary to the default MongoDB metrics, the WiredTiger output in serverStatus does contain information about transactions.

mongo_replica_0:PRIMARY> db.serverStatus().wiredTiger.transaction
{
    "number of named snapshots created" : 0,
    "number of named snapshots dropped" : 0,
    "transaction begins" : 21,
    "transaction checkpoint currently running" : 0,
    "transaction checkpoint generation" : 4610,
    "transaction checkpoint max time (msecs)" : 12,
    "transaction checkpoint min time (msecs)" : 0,
    "transaction checkpoint most recent time (msecs)" : 0,
    "transaction checkpoint total time (msecs)" : 6478,
    "transaction checkpoints" : 4610,
    "transaction failures due to cache overflow" : 0,
    "transaction range of IDs currently pinned" : 1,
    "transaction range of IDs currently pinned by a checkpoint" : 0,
    "transaction range of IDs currently pinned by named snapshots" : 0,
    "transaction sync calls" : 0,
    "transactions committed" : 14,
    "transactions rolled back" : 7
}

Metrics to keep an eye on are the trends in begins,committed and rolled back.

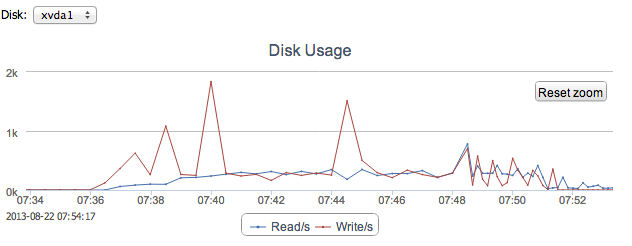
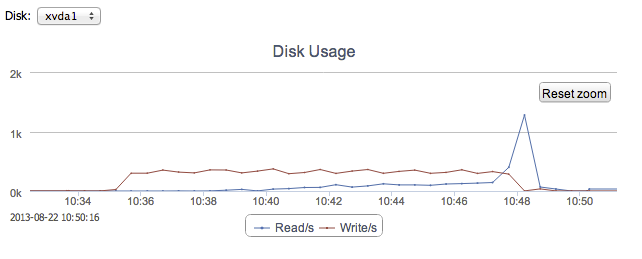
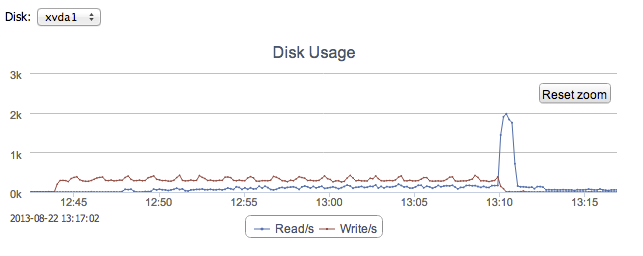
At the same time you can extract the checkpoint max time,checkpoint min time and checkpoint most recent time here. If the checkpointing time taken starts to increase WiredTiger isn’t able to checkpoint the data as quickly as before. It would be best to correlate this with disk statistics.

Cache

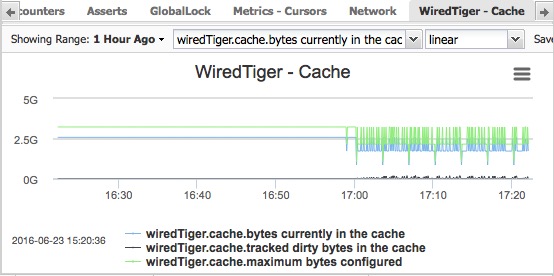
For WiredTiger the cache metrics are well accounted for, and these are the most important ones:

mongo_replica_0:PRIMARY> db.serverStatus().wiredTiger.cache
{
    "bytes currently in the cache" : 887889617,
    "modified pages evicted" : 561514,
    "tracked dirty pages in the cache" : 626,
    "unmodified pages evicted" : 15823118
}

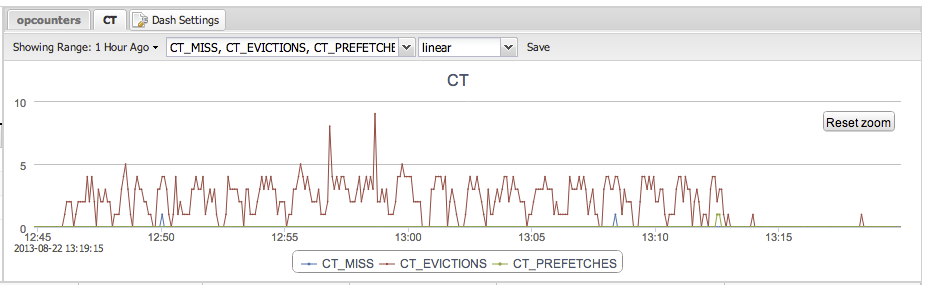
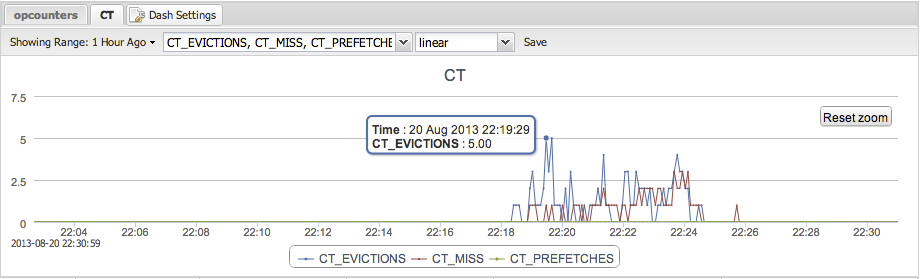
The evictions, both modified and unmodified, should be monitored. Evictions will happen once new data has to be retrieved from disk, and the least recently used (LRU) item will be removed from the cache. Increases in eviction rates means the data in the cache is never read back and thus evicted from the cache. If the evictions mostly happen on unmodified pages it means you can better cache them outside MongoDB. f the evictions happen mostly on the modified pages, the write workload is simply too big.

Conclusion

With this blog post you should be able to monitor and trend the most important metrics of MongoDB and WiredTiger. In a future blog post we will uncover more of the WiredTiger, MMAP and MongoRocks specifics. Our next post will be about Backup and Recovery.


How to monitor MongoDB (if you’re really a MySQL DBA) - Webinar Replay & Slides

$
0
0

Thanks to everyone who joined us for this week’s webinar on how to monitor MongoDB (for the MySQL DBA).

Art van Scheppingen, Senior Support Engineer at Severalnines, discussed the most important metrics to keep an eye on for MongoDB and described them in plain MySQL DBA language.

This webinar looked at answering the following questions (amongst others):

  • Which status overviews and commands really matter to you?
  • How do you trend and alert on them?
  • What is the meaning behind the metrics?

It also included a look at the open source tools available for MongoDB monitoring and trending. Finally, Art did a demo of ClusterControl’s MongoDB metrics, dashboards, custom alerting and other features to track and optimize the performance of your MongoDB system.

View the replay or read the slides

Agenda

  • How does MongoDB monitoring compare to MySQL
  • Key MongoDB metrics to know about
  • Trending or alerting?
  • Available open source MongoDB monitoring tools
  • How to monitor MongoDB using ClusterControl
  • Demo

Speaker

Art van Scheppingen is a Senior Support Engineer at Severalnines. He’s a pragmatic MySQL and Database expert with over 16 years experience in web development. He previously worked at Spil Games as Head of Database Engineering, where he kept a broad vision upon the whole database environment: from MySQL to Couchbase, Vertica to Hadoop and from Sphinx Search to SOLR. He regularly presents his work and projects at various conferences (Percona Live, FOSDEM) and related meetups.

This session is based upon the experience we have using MongoDB and implementing it for our database infrastructure management solution, ClusterControl. For more details, read through our ‘Become a MongoDB DBA’ blog series.

Become a MongoDB DBA: provisioning and deployment

$
0
0

If you are a MySQL DBA you may ask yourself why you would install MongoDB? That is actually a very good question as MongoDB and MySQL have been in a flame-war a couple of years ago. But there are many cases where you simply have to.

One of these use cases may be that the project that your company is going to deploy in production relies on MongoDB. Or perhaps one of the developers on the project had a strong bias for using MongoDB. Couldn’t they have used MySQL instead?

In some cases, it might not be possible to use MySQL. MongoDB is a document store and is suitable for different use cases as compared to MySQL(even with the recently introduced MySQL document store feature). Therefore we are starting this blog series to give you an excellent starting point to get yourself prepared for MongoDB.

Differences and similarities

At first sight the differences between MySQL and MongoDB are quite apparent: MongoDB is a document store that stores data in JSON formatted text. You can either generate your own identifiers or have MongoDB generate one and then have the document stored alongside as a blob, quite generic like most key-value stores.

MongoDB can be either a single Mongo instance or live in a clustered and/or shared environment. With MongoDB the master is called the primary and the slaves the secondary. The naming is different but also the replication works differently.

This can best be explained in the way MongoDB handles transactions: MongoDB is not ACID compliant, instead it offers functionality that goes beyond this. MongoDB will ensure transactions will be written to the oplog (comparable with the MySQL binlog) in more than just the primary: also to secondary nodes. You can configure it to confirm the transaction after either writing to the primary, a set of secondaries, the majority of the secondaries or all members. The last one is obvious the safest option and would be similar to synchronous replication and this obviously has a performance penalty. Many choose to only have MongoDB confirm when it has written to at least one member or the majority in the topology and effectively this means the topology will reach an eventual consistency.

If this actually raises alarm bells for you: think about how MySQL Asynchronous replication keeps your topology consistent. Yes, MongoDB replication is actually a lot better than MySQL replication and in high level overview looks a bit like the Galera replicator.

Databases are still called databases, but tables are called collections. Collections do not need a strict structure like in MySQL so the schema can be changed at any time. This also means your application has to be designed in a way that data may either be missing or it will actually receive unexpected data.

Obviously MongoDB has also a lot of similarities with MySQL. You still are working with a database that needs to perform a certain workload on a limited set of CPU cores, a limited amount of RAM and a lot of (hopefully) fast storage. This also means you have to treat it in a similar way as MySQL: allocate enough diskspace, benchmark your system to know how much IO you can do with MongoDB and keep an eye out for memory usage.

Also even if MongoDB features a schemaless design it still needs indexes to find the data. Similar to MySQL, it features primary and secondary indexes and it can apply or remove them at runtime.

MongoDB isn’t that different from MySQL after all.

Deploying MongoDB

Installing MongoDB on a clean host isn’t that difficult: you simply download the necessary packages from MongoDB and install them or use the official MongoDB repository to install.

I CONTROL  [initandlisten] MongoDB starting : pid=3071 port=27017 dbpath=/var/lib/mongo 64-bit host=n2
I CONTROL  [initandlisten] db version v3.2.6

After installing, you have a host that runs MongoDB and has no security enabled besides that it is configured to only listen on localhost. We must alter this default configuration to reflect our infrastructure: SSL, authentication and some other tuning parameters.

net:
  port: 27017
  bindIp: 172.16.0.30
  ssl:
    mode: requireSSL
    PEMKeyFile: /etc/ssl/mongodb.pem
    CAFile: /etc/ssl/ca.pem
  http:
    enabled: false
    RESTInterfaceEnabled: false
security:
  authorization: "enabled"

Apart from the configuration we want to create a MongoDB replica set to ensure we have our data stored a bit more secure. That also means we have to do the installation three times in a row and then set up the replication. Three times may not sound as much, but imagine that we will eventually create a sharded cluster out of our replica set. That means we will have to repeat the installation even more often in the future. Perhaps time to automate this using a provisioning tool?

Provisioning

If you already have your provisioning tools in place: there are some great options available for the most used ones. If not, these tools can help you automate your infrastructure by provisioning hosts, deployment of applications and, if necessary, orchestration of many nodes. You may take the Ansible example as a good beginner starting point.

Ansible

For ansible there are two options possible: the Ansible MongoDB example and the Stouts MongoDB role. Both implementations will cover installation, configuration and replication. The Ansible MongoDB example is a simple example that can easily be extended for your needs while the Stouts MongoDB role is meant for more advanced usage with Ansible.

Puppet

If you are using Puppet the best option is to use the Puppetlabs MongoDB module. This module is created and maintained by Puppetlabs. Even though the module is still in beta the structure of the module is good. It supports, next to installation, configuration and replication, also crude user management.

Chef

For Chef there are many cookbooks available, but the only cookbook that is currently actively maintained is the Mongodb3 cookbook. The cookbook supports installation, configuration, replication and sharding. It also is able to setup in AWS.

Saltstack

The MongoDB formula for Saltstack supports installation, configuration, replication and sharding.

Conclusion

All four are great starting points for deploying MongoDB. Obviously we still need to do additional configuration tweaking after deploying our initial hosts and that will be the focus of our next blog post.

Become a MongoDB DBA: The Basics of Configuration

$
0
0

After covering the deployment of MongoDB in our previous blogpost, we now move on to configuration basics. MongoDB is configured through both the config file (/etc/mongod.conf) and runtime. In the previous blogpost, we mentioned some of the configurables. We will go more in depth on each of them in this post.

MongoDB Topologies

To understand some of the configurables, we need to clarify the topologies of MongoDB.

We can simply start with the single standalone MongoDB instance. This is comparable to the MySQL single instance and naturally this topology will not have any data replicated from one host to another.

Once we replicate data between nodes, this is called a ReplicaSet in MongoDB. In our previous post we described briefly how the ReplicaSet works, but here is a condensed version: MongoDB will ensure transactions will be written to the oplog (comparable with the MySQL binlog) in more than just the primary (master): also to secondary nodes (slaves). You can configure it to confirm the transaction after either writing to the primary, a set of secondaries, the majority of the secondaries or all members.

For a ReplicaSet we need at least two instances to confirm a write, but it is advisable to use at least three. Confirmation can come from secondary nodes or an arbiter. A MongoDB ReplicaSet can best be compared to a hybrid between traditional MySQL replication and Galera synchronous replication.

The other topology to mention is MongoDB Sharding. MongoDB will be able to shard based upon the data stored in the Config Servers, and route the queries to the correct shards. In the picture below, the Config Servers and Shards are all independent ReplicaSets.

In this blog post, we will skip the configuration of sharding and save that for a future blog post.

MongoDB ReplicaSet Configuration

The most important configuration for the MongoDB ReplicaSet is the name of the ReplicaSet. We have to provide this name in every configuration file of MongoDB to ensure they are all part of the same ReplicaSet.

replication:
   replSetName: "ourreplicaset"

The remaining configuration for the MongoDB ReplicaSet has to be done at runtime. This runtime configuration will be stored in the so-called local database. This local database contains not only the data used for the replication process, but also information about the (other) instances in the ReplicaSet.

You can access most of this information via the rs object, using the various methods to write the replication configuration and retrieve its status. For instance, to show the current ReplicaSet configuration, you simply call rs.conf(). Since we haven’t set up our ReplicaSet yet, it will output an error similar to this:

Error: Could not retrieve replica set config: {
    "info" : "run rs.initiate(...) if not yet done for the set",
    "ok" : 0,
    "errmsg" : "no replset config has been received",
    "code" : 94
}

So what we need to do first is to initiate the ReplicaSet:

> rs.initiate()

Now we can define our hosts in the ReplicaSet:

> rs.add("host1.ourcompany.com")
> rs.add("host2.ourcompany.com")

And then we can check the status of our ReplicaSet:

> rs.status()

This is all that is necessary to set up a MongoDB ReplicaSet.

Now if we would want to add an arbiter, we simply install MongoDB on a host and run the following command:

mongod --port 30000 --dbpath /data/arb --replSet ourreplicaset

This will launch a mongod process that uses /data/arb to store configuration data (local database). Now all we have to do is add the arbiter to the ReplicaSet:

rs.addArb("host3.ourcompany.com:30000")

Now this host will only confirm writes in the ReplicaSet and not write any data to its own data directory.

Securing MongoDB

As we described in the previous post, MongoDB comes with very little security out of the box: for instance, authorization is disabled by default. In other words: anyone has root rights over any database. One of the changes MongoDB applied to mitigate risks was to change its default binding to 127.0.0.1. This prevents it being bound to the external ip address, but naturally this will be reverted by most people who install it.

Lately thousands of misconfigured and wide open MongoDB instances have been found, where even one of these instances contained personal information of 93 million Mexican voters. Securing your MongoDB instance is just as vital as securing any other database! We will explain in depth how to enable authorization and SSL.

Authorization

Enabling authorization is done by adding one line in the security section of your configuration:

security:
  authorization: "enabled"

Since no users have been defined yet, we can’t restart MongoDB after making this change. So what we need to do is to first create an account that can grant privileges:

> use admin
> db.createUser(
    {
        user: "myadmin",
        pwd: "verysecurepassword",
        roles: [ { role: "userAdminAnyDatabase", db: "admin" } ]
    }
)

Now restart MongoDB. After the restart, you need to pass the authenticationDatabase parameter as well if you log in with the newly created admin account:

$ mongo -u "myadmin" -p "verysecurepassword" --authenticationDatabase "admin"

You will be able to perform admin tasks only after authenticating against the admin database, e.g., creating new users. So suppose you wish to create new users, you have to provide the authenticationDatabase first and then create the new users.

$ mongo -u "myadmin" -p "verysecurepassword" --authenticationDatabase "admin"> use mytest
> db.createUser(
    {
        user: "mytestuser",
        pwd: "test1234",
        roles: [ { role: "readWrite", db: "mytest" } ]
    }
)

In our case, the mytest database did not exist before. Even though it does not exist yet, we can already grant other users access to it. Naturally, as a MySQL DBA, I would be tempted to create the first collection (like a table) in this database. But I would not be able to do so:

> db.createCollection("mycollection")
{
    "ok" : 0,
    "errmsg" : "not authorized on mytest to execute command { create: \"mycollection\" }",
    "code" : 13
}

We can explain this simply by comparing it to MySQL. In MySQL, the grantee needs to have the same rights as what it is granting to another user. But in MongoDB, the userAdmin role is only able to administrate users. If you wish to have similar functionality as what you are used to in MySQL, you can additionally grant readWriteAnyDatabase and/or root roles. The latter will open up all admin functionality for this user.

So now we will be able to login to this database with the test user:

$ mongo -u "mytestuser" -p "test1234" mytest

And create the collection:

> use mytest
> db.createCollection("mycollection")
{ "ok" : 1 }

You can find more information on the MongoDB built in authentication roles here.

SSL

Enabling encryption on database communication has become a necessity in the past few years, especially when databases are deployed in the cloud. This accounts for both internal and external traffic. MongoDB supports encryption of both client-server connection and intra-cluster communication.

Once you enable Transport Encryption in MongoDB, all of the network traffic of MongoDB will be encrypted using TLS/SSL (Transport Layer Security/Secure Sockets Layer). When enabled, both internal and external communication will be encrypted. There is no possibility to do only one of them.

To enable encryption, we need to generate our certificate and private key first.

$ cd /etc/ssl/
$ openssl req -newkey rsa:2048 -new -x509 -days 365 -nodes -out mongodb-cert.crt -keyout mongodb-cert.key

This will create a self-signed certificate without password, that is valid for one year. We need to concatenate the private key and the certificate to create a PEM file:

$ cat mongodb-cert.key mongodb-cert.crt > mongodb.pem

And then we can configure MongoDB to use the PEM file:

net:
   ssl:
      mode: requireSSL
      PEMKeyFile: /etc/ssl/mongodb.pem

After we have restarted MongoDB, we will no longer be able to use unencrypted connections to MongoDB:

$ mongo -u "mytestuser" -p "test1234" mytest
MongoDB shell version: 3.2.6
connecting to: mytest
2016-05-24T16:39:41.950+0000 E QUERY    [thread1] Error: network error while attempting to run command 'isMaster' on host '127.0.0.1:27017'  :
connect@src/mongo/shell/mongo.js:229:14
@(connect):1:6

Connecting to MongoDB providing the --ssl option will result in the following error:

$ mongo -u "mytestuser" -p "test1234" mytest --ssl
MongoDB shell version: 3.2.6
connecting to: mytest
2016-05-24T16:39:52.988+0000 E NETWORK  [thread1] SSL peer certificate validation failed: self signed certificate
2016-05-24T16:39:52.988+0000 E QUERY    [thread1] Error: socket exception [CONNECT_ERROR] for SSL peer certificate validation failed: self signed certificate :
connect@src/mongo/shell/mongo.js:229:14
@(connect):1:6

As we have created a self-signed certificate, MongoDB client will try to validate our certificate. Of course if you do own a valid certificate and configured this certificate, MongoDB wouldn’t complain about this. To overcome the certificate validation, we have to provide the --sslAllowInvalidCertificates parameter:

$ mongo -u "mytestuser" -p "test1234" mytest --ssl --sslAllowInvalidCertificates
MongoDB shell version: 3.2.6
connecting to: mytest
2016-05-24T17:09:15.752+0000 W NETWORK  [thread1] SSL peer certificate validation failed: self signed certificate
2016-05-24T17:09:15.752+0000 W NETWORK  [thread1] The server certificate does not match the host name 127.0.0.1
>

If you wish to validate the client with CA-signed certificate, you have to configure MongoDB with the CAFile configurable:

net:
  ssl:
    CAFile: /etc/ssl/ca.pem

This will force the client to use both a PEM and CA file for establishing the connection.

HTTP and REST

Up until MongoDB 3.2, there used to be an HTTP status page on port 28017, but as of 3.2 this status page has been deprecated. This status page was very useful for gaining insights into what is happening in your MongoDB instance. When exposed to the outside world, it would give a little too much information. However, enabling authorization in MongoDB would enforce anyone to authenticate against the HTTP status page, but Kerberos and the new SCRAM-SHA1 are not supported.

So if you choose to install a version prior to 3.2 and not enable authorization: it is recommended to disable the HTTP interface or at least shield it from the outside.

To disable, simply add the following configuration:

net:
  http:
    enabled: false

Next to the HTTP interface, there is also the simple REST api. It uses the same port number as the HTTP status page, with a REST path built up using the structure /databasename/collectionname?option=value. Naturally the REST api outputs JSON formatted data. This makes it ideal to extract information from MongoDB in web frameworks using this API.

However, just as with the HTTP status page, when authorization has been enabled MongoDB requires client authentication, while Kerberos and the new SCRAM-SHA1 are not supported. So it will be better to disable both the HTTP status page and the REST api.

net:
  http:
    enabled: false
    RESTInterfaceEnabled: false

If you are in need of a REST api, there are better alternatives around that do support Kerberos and SCRAM-SHA1 authentication. You can find an overview in the MongoDB documentation.

Conclusion

We have gone more in depth on the configuration specifics of the MongoDB topologies and security. We hope you have a good insight in how to set up a replica set, SSL and disable the HTTP and REST interface. In the next blog post we will focus more on the monitoring and trending in MongoDB.

ClusterControl Developer Studio: MongoDB Replication Lag Advisor

$
0
0

In the previous blog posts, we gave a brief introduction to the ClusterControl Developer Studio and the ClusterControl Domain Specific Language. We covered some useful examples, e.g., how to extract information from the Performance Schema and how to automatically have advisors scale your database clusters. ClusterControl Developer Studio allows you to write your own scripts, advisors and alerts. With just a few lines of code, you can already automate your clusters!

In this blog post, we will show you, step by step, how we implemented our MongoDB replication lag advisor in Developer Studio. We have included this advisor in ClusterControl 1.3.2, and enabled it by default on any MongoDB cluster or replicaSet.

MongoDB Replication lag

Why do we need advisors to warn us about replication lag? Imagine one of the secondary nodes in MongoDB is lagging behind for some unknown reason. This poses three risks:

  1. The MongoDB oplog is limited in size. If the node lags behind too far, it won’t be able to catch up. If this happens, a full sync will be issued and this is an expensive operation that has to be avoided at all times.
  2. Secondary nodes lagging behind are less likely to become primary after the primary node fails. A less favorable secondary node may be elected then.
  3. Secondary nodes lagging behind will less likely to be used for read requests offloading by the primary node. This increases the load on the primary.

As you can see, there are enough reasons to keep a close eye on the replication lag, to receive warnings on time and perform actions to prevent this from happening.

Calculating MongoDB Replication lag

To check the replication lag, it suffices to connect to the primary and retrieve this data using the replSetGetStatus command. In contrary to MySQL, the primary keeps track of the replication status of its secondaries.

A condensed version is seen below:

my_mongodb_0:PRIMARY> db.runCommand( { replSetGetStatus: 1 } )
{
… 
    "members" : [
        {
            "_id" : 0,
            "name" : "10.10.32.11:27017",
            "stateStr" : "PRIMARY",
            "optime" : {
                "ts" : Timestamp(1466247801, 5),
                "t" : NumberLong(1)
            },
            "optimeDate" : ISODate("2016-06-18T11:03:21Z"),
        },
        {
            "_id" : 1,
            "name" : "10.10.32.12:27017",
            "stateStr" : "SECONDARY",
            "optime" : {
                "ts" : Timestamp(1466247801, 5),
                "t" : NumberLong(1)
            },
            "optimeDate" : ISODate("2016-06-18T11:03:21Z"),
        },
        {
            "_id" : 2,
            "name" : "10.10.32.13:27017",
            "stateStr" : "SECONDARY",
            "optime" : {
                "ts" : Timestamp(1466247801, 5),
                "t" : NumberLong(1)
            },
            "optimeDate" : ISODate("2016-06-18T11:03:21Z"),
        }
    ],
    "ok" : 1
}

You can calculate the lag by simply subtracting the secondary optimeDate (or optime timestamp) from the primary optimeDate. This will give you the replication lag in seconds.

Query the Primary Node

As described in the previous paragraph: we need to query the primary node to retrieve the replication status. So how would you query only the primary node in Developer Studio?

In Developer Studio, we have specific host types for MySQL, MongoDB and PostgreSQL. For a MongoDB host, you are able to perform a query against MongoDB on the host using the executeMongoQuery function.

First we iterate over all hosts in our cluster, and then check if the selected node is the master by issuing a MongoDB query that returns this state:

for (i = 0; i < hosts.size(); i++)
{
    // Find the master and execute the queries there
    host = hosts[i];
    res = host.executeMongoQuery("{isMaster: 1}");
    if (res["result"]["ismaster"] == true) {
… 

Now that we have ensured we are on the primary node, we can query the host for the replication status:

res = host.executeMongoQuery("{ replSetGetStatus: 1 }");

This returns a map object that we can use to create a new array with the optime per host. Once we have found the master, we also keep a reference to the element in this array for later use:

for(o = 0; o < res["result"]["members"].size(); o++)
{
    node_status = res["result"]["members"][o];
    // Keep reference to the master host
    if (node_status["name"] == master_host)
    {
        optime_master = o;
    }
    optime_nodes[o] = {};
    optime_nodes[o]["name"] = node_status["name"];
    optime_nodes[o]["optime"] = node_status["optime"]["ts"]["$timestamp"]["t"];                   
}

Now it really has become easy to calculate the replication lag per host, and give advice if necessary:

// Check if any of the hosts is lagging
for(o = 0; o < optime_nodes.size(); o++)
{
    replication_lag = optime_nodes[optime_master]["optime"] - optime_nodes[o]["optime"];
    if(replication_lag > WARNING_LAG_SECONDS)
    {
        advice.setSeverity(Warning);
        msg = ADVICE_WARNING + "Host " + optime_nodes[o]["name"] + " has a replication lag of " + replication_lag + " seconds.";
    }
}

After scheduling the script the output will look similar to this in the advisor page:

Improvements

Naturally this check only advises for the pre-set replication lag. We can improve this advisor by also comparing the replication lag per host with the replication window inside the oplog. Once we have this metric inside ClusterControl, we will add this to the advisor.

Conclusion

With a very simple advisor, we are able to monitor the replication lag. Reasons for lagging can be network latency, disk throughput, concurrency and bulk loading. In the case of network latency, disk throughput and concurrency, you should be able to correlate these advisors with the respective graphs available in ClusterControl. For bulk loading, you would see this as an increase of writes in the ops counters.

The complete advisor

#include "common/helpers.js"
#include "cmon/io.h"
#include "cmon/alarms.h"

var WARNING_THRESHOLD=90;
var WARNING_LAG_SECONDS = 60;
var TITLE="Replication check";
var ADVICE_WARNING="Replication lag detected. ";
var ADVICE_OK="The replication is functioning fine." ;


function main(hostAndPort) {

    if (hostAndPort == #N/A)
        hostAndPort = "*";

    var hosts   = cluster::mongoNodes();
    var advisorMap = {};
    var result= [];
    var k = 0;
    var advice = new CmonAdvice();
    var msg = "";
    for (i = 0; i < hosts.size(); i++)
    {
        // Find the master and execute the queries there
        host = hosts[i];
        res = host.executeMongoQuery("{isMaster: 1}");
        if (res["result"]["ismaster"] == true) {
            master_host = host;
            optime_master = 0;
            optime_nodes = [];
            res = host.executeMongoQuery("{ replSetGetStatus: 1 }");
            // Fetch the optime per host
            for(o = 0; o < res["result"]["members"].size(); o++)
            {
                node_status = res["result"]["members"][o];
                // Keep reference to the master host
                if (node_status["name"] == master_host)
                {
                    optime_master = o;
                }
                optime_nodes[o] = {};
                optime_nodes[o]["name"] = node_status["name"];
                optime_nodes[o]["optime"] = node_status["optime"]["ts"]["$timestamp"]["t"];
                    
            }
            msg = ADVICE_OK;
            // Check if any of the hosts is lagging
            for(o = 0; o < optime_nodes.size(); o++)
            {
                replication_lag = optime_nodes[optime_master]["optime"] - optime_nodes[o]["optime"];
                if(replication_lag > WARNING_LAG_SECONDS)
                {
                    advice.setSeverity(Warning);
                    msg = ADVICE_WARNING + "Host " + optime_nodes[o]["name"] + " has a replication lag of " + replication_lag + " seconds.";
                }
            }
            
            if (advice.severity() <= 0) {
                advice.setSeverity(Ok);
            }
        }
        advice.setHost(host);
        advice.setTitle(TITLE);
        advice.setAdvice(msg);
        advisorMap[i]= advice;
    }
    return advisorMap;
}

Become a MongoDB DBA: Backing up your data

$
0
0

In previous posts of our MongoDB DBA series, we have covered Deployment, Configuration, Monitoring (part 1) and Monitoring (part 2). The next step is ensuring your data gets backed up safely.

Backups in MongoDB aren’t that different from MySQL backups.You have to start a copy process, ship the files to a safe place and ensure the backup is consistent. The consistency is obviously the biggest concern, as MongoDB doesn’t feature a transaction mode that allows you to create a consistent snapshot. Obviously there are other ways to ensure we make a consistent backup.

In this blog post we will describe what tools are available for making backups in MongoDB and what strategies to use.

Backup a replicaSet

Now that you have your MongoDB replicaSet up and running, and have your monitoring in place, it is time for the next step: ensure you have a backup of your data.

You should backup your data for various reasons: disaster recovery, providing data to development or analytics, or even pre-load a new secondary node. Most people will use backups for the first two reasons.

There are two categories of backups available for MongoDB: logical and physical backups. The logical backups are basically data dumps from MongoDB, while the physical backups are copies of the data on disk.

Logical backups

All logical backup methods will not make a consistent backup, not without putting a global lock on the node you’re making a backup of. This is comparable to mysqldump with MyISAM tables. This means it would be best to make a logical backup from a secondary node and set a global lock to ensure consistency.

For MongoDB there is a mysqldump equivalent: mongodump. This command line tool is shipped with every MongoDB installation and allows you to dump the contents of your MongoDB node into a BSON formatted dump file. BSON is a binary variant of JSON and this will not only keep the dump compact, but also improves recovery time.

The mongodump tool is easy to use, but due to all the command line options, it may need some wrapping to get automated backups. Open source alternatives are available, e.g., MongoDB Backup and Mongob.

MongoDB Backup is a Node.js solution that allows both command line and API access invocation. Since it is a Node.js application including an API, you could quite easily embed this into chat clients, or automated workflows. MongoDB Backup also allows you to make stream backups, so offsite backups are easy to manage this way.

Mongob is only available as a command line tool and written in Python. Mongob will offer you great flexibility by streaming to a bzip file or to another MongoDB instance. The latter obviously is very useful if you wish to provide data copies to your development or CI environments. It can also easily copy data between collections. Incremental backups are also possible, and this can keep the size of your backups relatively small. Rate limiting is also an option, for instance if you need to send the backup over a slow(er) public network and don’t want to saturate it.

Physical backups

For physical backups, there is no out of the box solution. Options here are to use the existing LVM, ZFS and EBS snapshot solutions. For LVM and ZFS, the snapshotting will freeze the file system in operation. However for EBS, a consistent snapshot can’t be created unless writes have been stopped.

To do so, you have to fsync everything to disk and set a global lock:

my_mongodb_0:PRIMARY> use admin
switched to db admin
my_mongodb_0:PRIMARY> db.runCommand({fsync:1,lock:1});
{
    "info" : "now locked against writes, use db.fsyncUnlock() to unlock",
    "seeAlso" : "http://dochub.mongodb.org/core/fsynccommand",
    "ok" : 1
}

Don’t forget to unlock after completing the EBS snapshot:

my_mongodb_0:PRIMARY> db.fsyncUnlock()
{ "info" : "unlock completed", "ok" : 1 }

As MongoDB only checkpoints every 60 seconds, this means you will have to also include the journals. If these journals are not on the same disk, your snapshot may not be 100% consistent. This would be similar as making an LVM snapshot of a disk only containing the MySQL data without the redo logs.

If you are using MongoRocks, you also have the possibility to make a physical copy of all the data using the Strata backup tool. The Strata command line tool allows you to create a full backup or incremental backup. The best part of the Strata backup is that these physical files are queryable via mongo shell. This means you can utilize physical copies of your data to load data into your data warehouse or big data systems.

Sharded MongoDB

As the sharded MongoDB cluster consists of multiple replicaSets, a config replicaSet and Shard servers, it is very difficult to make a consistent backup. As every replicaSet is decoupled from each other, it is almost impossible to snapshot everything at the same time. Ideally a sharded MongoDB cluster should be frozen for a brief moment in time, and then a consistent backup taken. However this strategy would cause global locks and this means your clients will experience downtime.

At this moment, the next best thing you can do is to make a backup around roughly the same time of all components in the cluster. If you really need consistency, you can fix this during the recovery by applying a point-in-time recovery using the oplogs. More about that in the next blog post that covers recovery.

Backup scheduling

If possible, don’t backup the primary node. Similar to MySQL you don’t want to stress out the primary node and set locks on it. It would be better to schedule the backup on a secondary node, preferably one without replication lag. Also keep in mind that once you start backing up this node, replication lag may happen due to the global locks set. So keep an eye on the replication window.

Make sure your backup schedule makes sense. If you create incremental backups, make sure you regularly have a full backup as a starting point. A weekly full backup makes sense in this case.

Also daily backups would be fine for disaster recovery, but for point-in-time recovery they won’t work that well. MongoDB puts a timestamp on every document and you could use that to perform a point in time recovery. However if you would remove all inserted/altered documents from a newer backup by using the timestamp it won’t be an exact recovery: the document could have been updated several times or deleted in the underlying period.

Point in time recovery can only be exact if you still have the oplog of the node you wish to recover, and replay it against an older backup. It would also be wise to make regular copies of the oplog to ensure you have this file when needed for a point-in-time recovery, e.g., in case of full outage of your cluster. Even better: stream the oplog to a different location.

Backup strategies

Ensure backups are being made, so check your backup on a regular interval (daily, weekly). Make sure the size of the backups makes sense and the logs are clear from errors. You could also check the integrity of the backup by extracting it and making a couple of checks on data points or files that need to be present. Automation for this process makes your life easier.

Offsite backups

There are many reasons for shipping your backups to another location. The best known reason may be (disaster) recovery, but other good reasons are keeping local copies for testing or data loading to offload the production database.

You could send your backups, for instance, to another datacenter or Amazon S3 or Glacier. To automatically ship your backups to a second location, you could use BitTorrent Sync. If you ship your backups to a less trusted location, you must store your backups encrypted.

Backup encryption

Even if you are keeping your backups in your local datacenter, it is still a good practice to encrypt them. Encrypting the backups will ensure nobody, unless they have the key, will be able to read them. Especially backups made using Strata will be partly readable, without the necessity to start up MongoDB. But also dumps via Mongodump and filesystem snapshots will be partly readable. So consider MongoDB backups to be insecure and always encrypt them. Storing them in a cloud even makes the necessity for encryption bigger.

Recovery

In addition to the health checks, also try to restore a backup on a regular (monthly) basis to verify if you can recover from a backup. This process includes extracting/decrypting the backup, starting up a new instance and possibly starting replication from the primary. This will give you a good indication whether your backups are in good condition. If you don’t have a disaster recovery plan yet, make one and make sure these procedures are part of it.

Conclusion

We have explained in this blog post what matters in making backups of MongoDB and how different/similar it is to backing up similar MySQL environments. There are a couple of caveats with making backups of MongoDB, but these are easily overcome with caution, care and tooling.

In the next blog post, we will cover restoring MongoDB replicaSets from backups and how to perform a point-in-time recovery!

Viewing all 206 articles
Browse latest View live